Understanding DVT IDE memory usage
The main goal of this application note is to help you understand the memory usage of DVT.
First, two important concepts involved in memory usage analysis need to be clarified: resident and virtual memory.
To better understand the applicability of the previously mentioned concepts, it is important to have an architectural view over DVT IDE for VS Code extension.
The DVT IDE extension is split in two components:
The VS Code specific component which implements the DVT IDE frontend
The Language Server component which implements the DVT IDE backend functionality (compiling the code, serving information to the frontend, etc) and runs as a separate process. This is the heaviest component in the stack because its memory and CPU requirements depend on the size of your project.
Note
Only the memory used by the Language Server may be tuned by the user.
Resident Memory
Resident memory usage represents the actual physical memory (RAM) used by an application at a given time. It includes the executable code, the dynamic libraries, and the stack and heap space required by the application during runtime. Resident memory is directly managed by the operating system and is critical for an application’s performance.
Usually, resident memory is computed using the allocated heap size and the additional memory an application consumes during execution (such as memory used by the JVM or other off-heap memory allocation performed by various mechanisms).
You can specify the amount of memory that DVT may use via:
The
-heap_sizeargument when using the dvt_ls.sh or dvt_code.sh scriptsDirect specification in the .dvt/build_name.ls file
The optimal value depends on the project’s size, and is typically determined by an iterative process. The default is 3G.
There are two mechanisms available to check how much heap DVT is using:
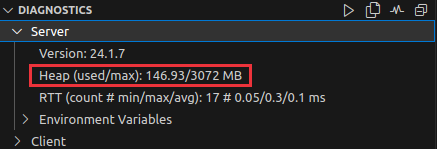
By checking the Heap (used/max) entry from DVT Activity > Diagnostics > Server`

By looking in the Status Bar > Language Server Heap Status. This mechanism is off by default. You can enable it in the preferences:


As a general rule, the heap usage should be around half of the max heap, to allow plenty of headroom for subsequent operations such as incremental builds, diagram generation, refactorings, semantic searches, etc.
Virtual Memory
Virtual memory is an abstraction provided by the operating system that allows an application to virtually access more memory than is physically available. It provides each application with its own virtual address space, which is typically much larger than the available physical memory. The operating system’s memory manager oversees virtual memory, a combination of RAM and disk space, including various system handles, memory-mapped files, and so on. Since some portions of this memory are allocated but remain untouched, the operating system loads only the necessary portions into physical memory, making the overall size of virtual memory largely irrelevant.
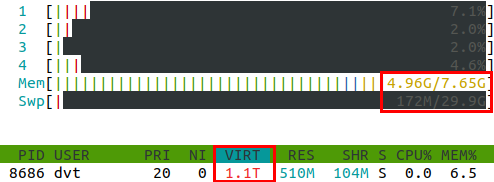
For instance, in the following example, a process is using 1.1T of virtual memory, while the total amount of physical memory is less than 38G (Mem+Swp).

As a bottom line, since Virtual Memory is not a limited physical resource, it is not a good measurement for resource allocation or memory profiling.
Note
Virtual memory is responsible for making use of address space which is limited to the width of the registers. That limitation is visible on 32-bit processors, as its registers can store up to 2^32 (4GB) of addresses.
For that reason, watchdogs were used on 32-bit systems to limit the amount of virtual memory an application can use. This is no longer necessary for current 64-bit processors which can hold up to 2^64 addresses.