Debugger Integration
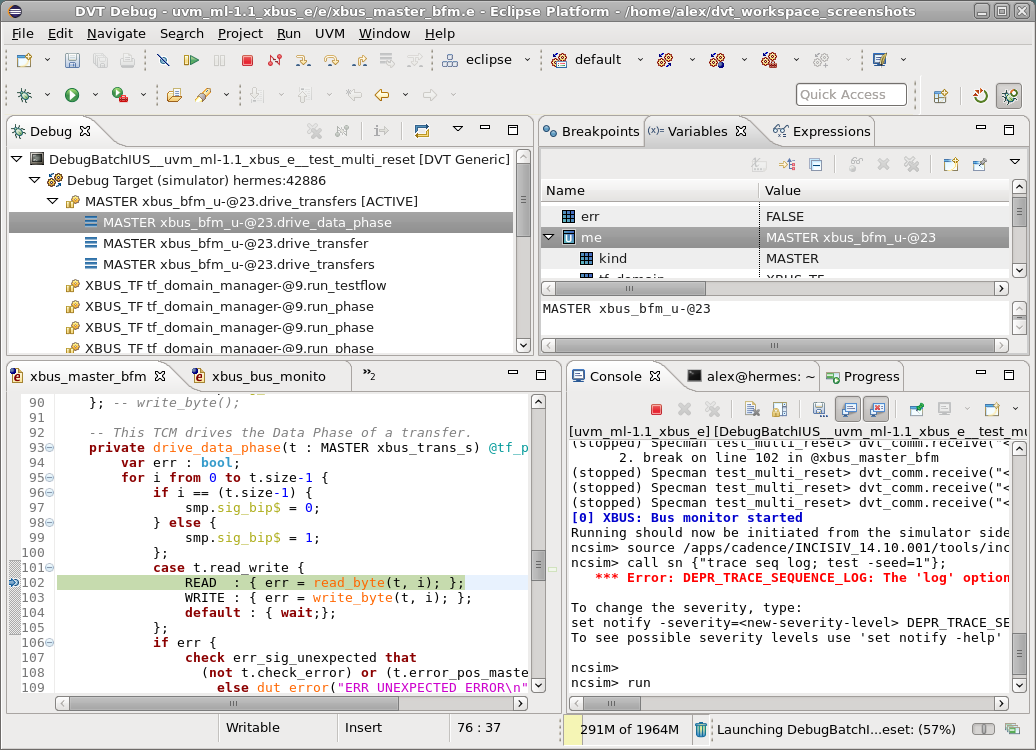
The DVT Debugger Integration allows you to debug your code from within the IDE: add breakpoints, control the simulation (stop, resume, step), inspect variables and so on. You can launch your simulation as usual, or from within DVT using Run Configurations. All you need to do on the simulator side is load a specific DVT debugger library and, depending on the simulator, pass some debug enablement switches.
DVT provides a dedicated DVT Debug perspective that helps you perform simulation debug related activities. DVT will prompt you to switch to this perspective whenever you launch or connect to a simulation in debug mode.
