Launch a Debug Simulation
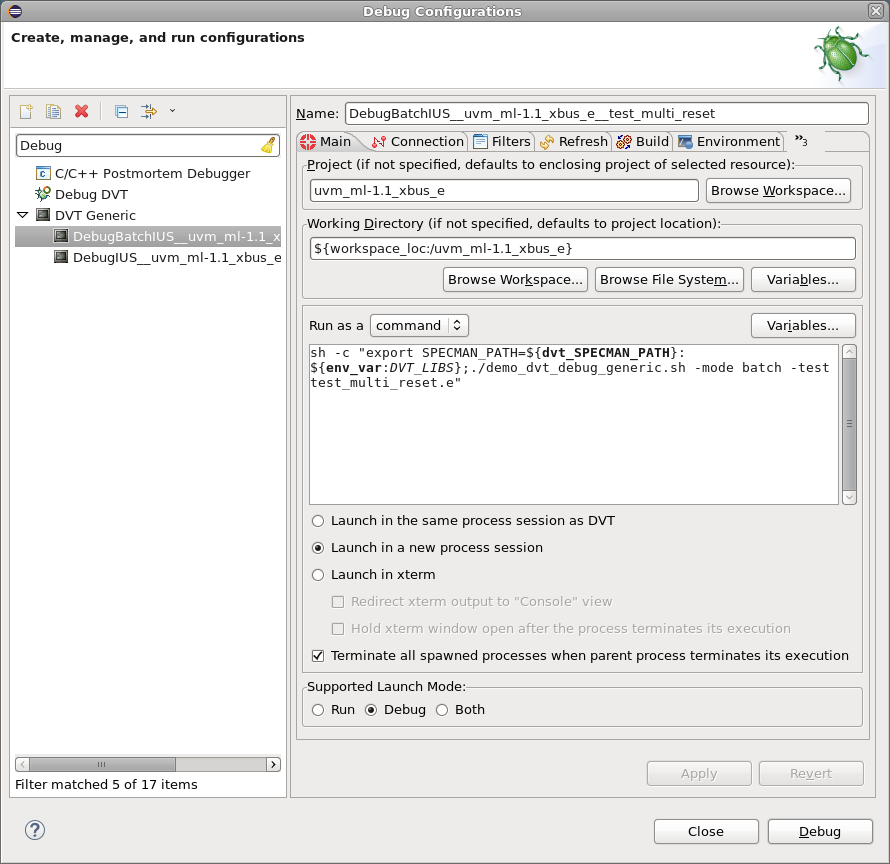
In order to launch a new debug simulation from DVT you just need to define a DVT Generic Debug Configuration from menu Run > Debug Configurations… > as shown in the snapshot below. Then you click Debug.
The launch command can be any script that invokes your simulation. Just remember the Simulation Prerequisites. You can find examples in the Predefined Projects.

Note
You may chose the supported launch mode for the configuration: Run, Debug or Both. When launched in Debug mode, the environment of the executed process contains the DVT_LAUNCH_MODE variable set to ‘generic_debug’.
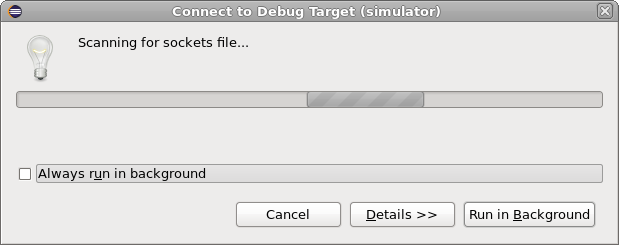
As soon as you launch the simulation, DVT waits for the simulator communication socket to be ready. It polls the working directory for a file which contains the socket details (host and port).

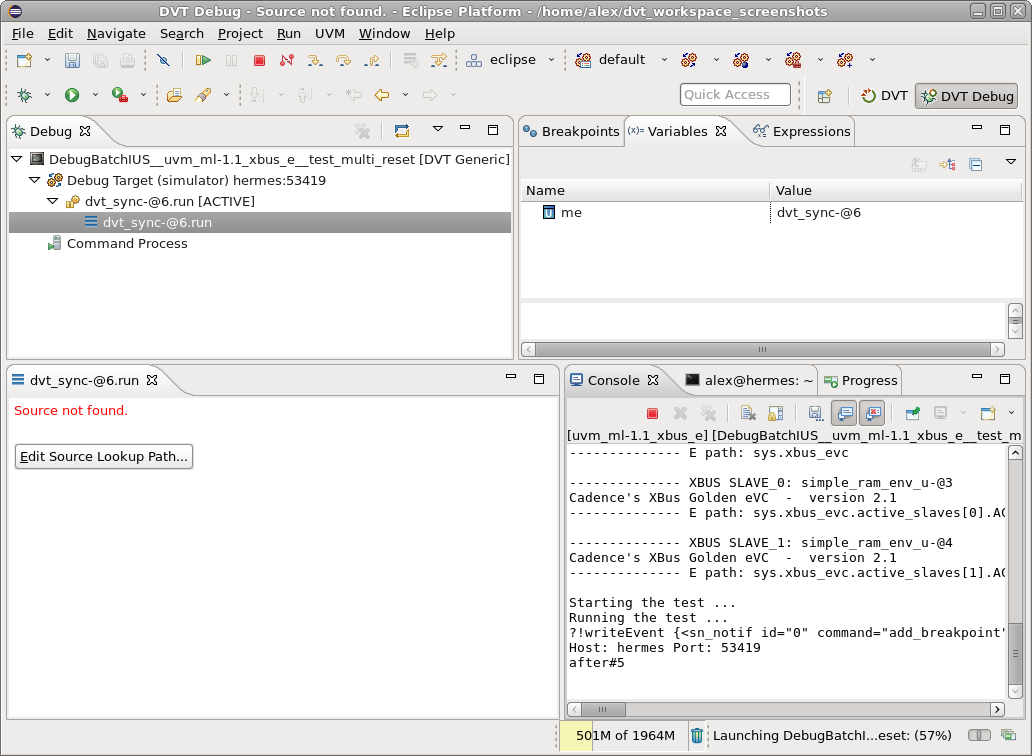
As soon as the sockets file is found, DVT prompts you to switch to the DVT Debug perspective, which is a specific GUI layout for debugging activities.

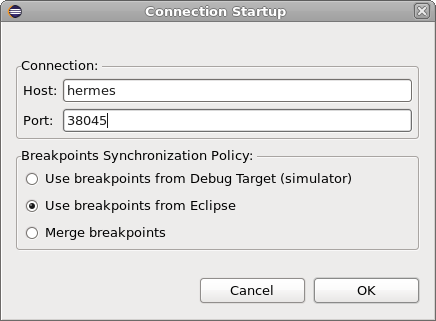
Finally a dialog pops up, it presents the connection info and allows you to chose the breakpoints handling policy.

If disconnected
If you got disconnected, you can always launch again in Debug Mode, you’ll be presented with the option to re-connect.

dvt_sync (e Language Only)
Assuming your script starts the simulation, you’ll see the debugger stopped inside a dvt_sync encrypted module. This is used for initial handshake with Specman. Without it the simulation will proceed without DVT being able to send over information to Specman. It also allows you to add breakpoints, if you didn’t already.
Just click Continue. The simulation will stop at the next breakpoint.
