How to Report an Issue ?
DVT IDE for Eclipse
You can send an issue report right from the DVT GUI using the Report an Issue dialog.
Along with a problem description, we often need logs and system information in order to reproduce a problematic behavior and fix it.
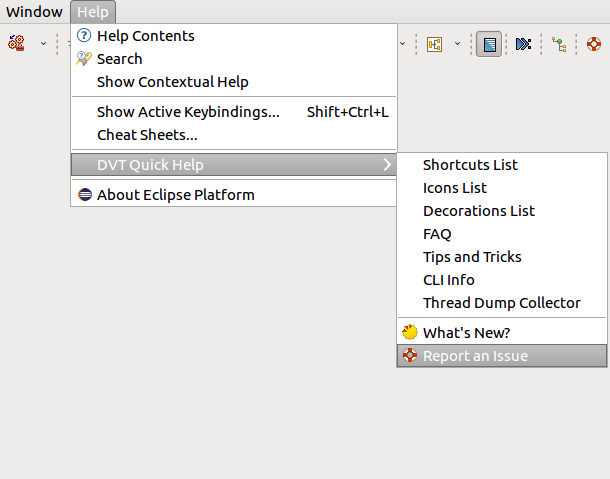
Go to menu or simply click the toolbar button:


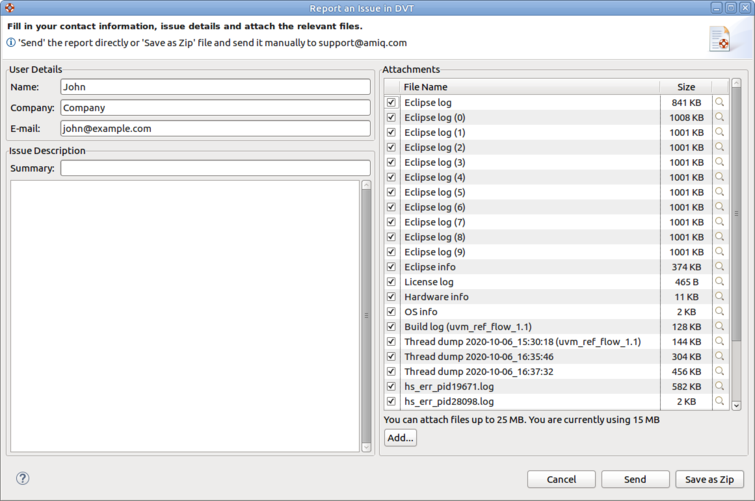
Fill in the identification data (will be remembered for future reports) and issue description.
Attach screenshots, code snippets or any other files you consider helpful in reproducing the problem.
By default various application logs and diagnostic files are attached.
You can preview any attachment using the magnifier icon.

When you click Send, an e-mail is sent to support@amiq.com with your own address in CC.
You can also save the issue report as a zip archive, and send it manually to support@amiq.com (for example if you don’t have Internet connectivity on the machine where DVT runs).
The most useful debug information when dealing with performance issues is a JVM thread dump. Most likely this will help us pinpoint the problem and provide a fast solution.
How to generate a thread dump from within DVT Eclipse?
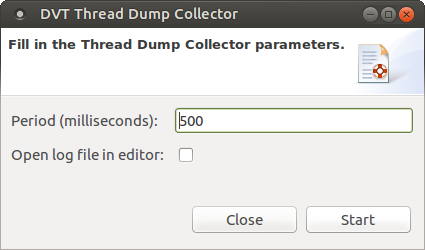
To generate a thread dump from within DVT go to .
Start the collector, then do the operation that causes the performance issue and afterwards stop the process from the same dialog.

You can also use the Start Thread Dump Collector and Stop Thread Dump Collector shortcuts from the Quick Access bar (Ctrl+3).
The thread dump is generated in the directory of the currently selected DVT project.
How to generate a thread dump from outside DVT Eclipse?
Assuming the DVT GUI is frozen, you can still generate a thread dump by running a script. Open a terminal, log into the machine where DVT runs and run the following command:
$DVT_HOME/bin/dvt_debug_utils.sh -workspace <dvt_workspace_location> -thread_dump -nof_kills 60 -tbs 500ms
The thread dump file is generated in the <dvt_workspace_location>.
How to generate a thread dump for Verissimo & Specador running in batch mode?
Open a terminal and log into the machine where Verissimo/Specador runs. Identify the PID of the Verissimo/Specador java process, for example:
ps aux | grep ro.amiq.dvt.main.specador.SpecadorMain
ps aux | grep ro.amiq.vlogdt.main.VerissimoMain
Run the following command:
$DVT_HOME/bin/dvt_debug_utils.sh -pid <PID> -thread_dump -nof_kills 60 -tbs 500ms
The thread dump is generated in the current directory.
Note
Thread dumps can be automatically generated for specific named actions that the tool performs using the +dvt_profile+<name>[ +<name>][ +<period_ms>] build configuration directive, where <name> is one of: VLOG_RI, VLOG_RC, VLOG_RD, VLOG_US, VLOG_EP, VLOG_CP, VHDL_RU, VHDL_RT, VHDL_RD, VHDL_US, VHDL_USBD, VHDL_CP, ELAB, UNEL, ALL.
DVT IDE for VS Code
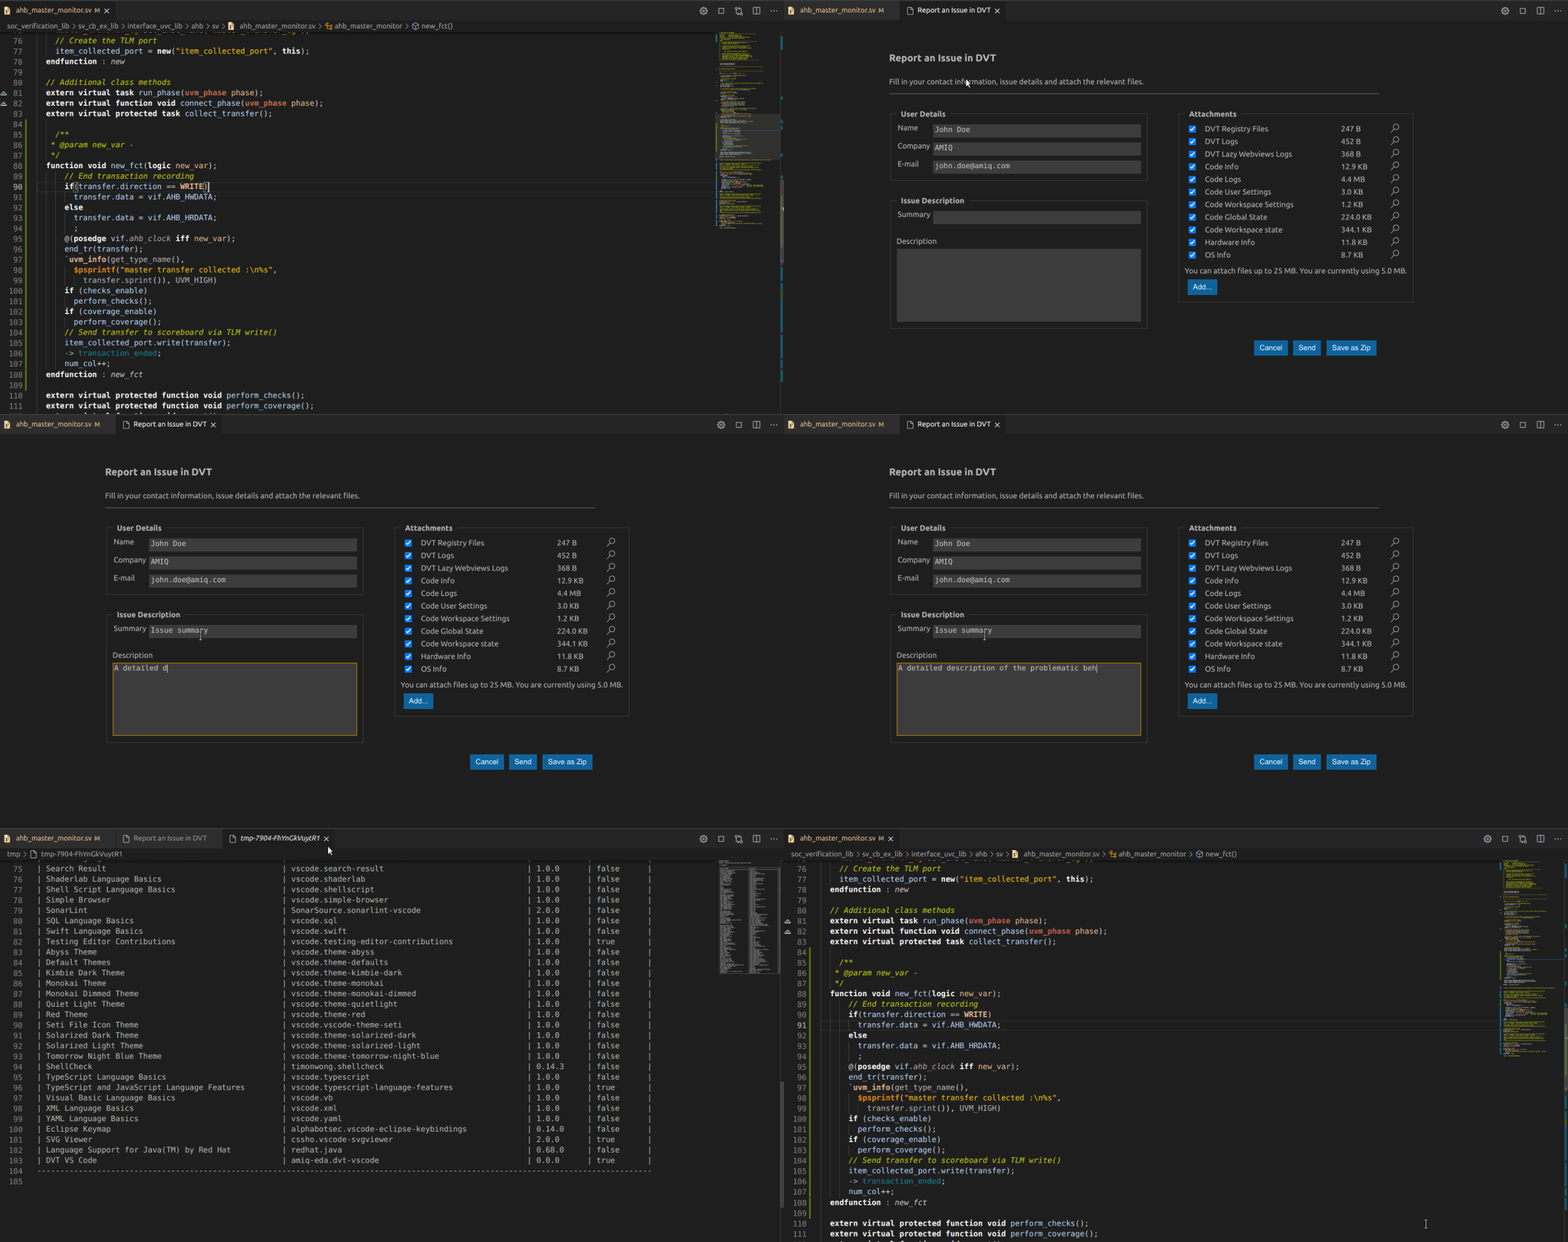
You can send an issue report using the DVT: Report an Issue command. Along with a problem description, we often need logs and system information in order to reproduce a problematic behavior and fix it.
Fill in the identification data (will be remembered for future reports) and issue description.
Attach screenshots, code snippets or any other files you consider helpful in reproducing the problem.
Note
By default various application logs and diagnostic files are attached.
You can preview any attachment using the magnifier icon.
When you click Send, an e-mail is sent to support@amiq.com with your own address in CC.
You can also save the issue report as a zip archive, and send it manually to support@amiq.com (for example if you don’t have Internet connectivity on the machine where DVT runs).
The most useful debug information when dealing with performance issues is a JVM thread dump. Most likely this will help us pinpoint the problem and provide a fast solution.

How to generate a thread dump from within DVT for VS Code?
To generate a thread dump from within DVT for VS Code use the DVT: Start Thread Dump Collector command. Perform the operation that causes the performance issue and afterwards stop the process using the DVT: Stop Thread Dump Collector command.
The thread dump is generated at $HOME/.dvt/ls/logs/profiling.
Note
The DVT: Start Thread Dump Collector / DVT: Stop Thread Dump Collector commands can be invoked also by using the buttons from the Diagnostics View toolbar.
How to generate a thread dump for a Verissimo rule
There are two ways to generate thread dumps for a rule. The first one is to run verissimo.sh with the thread_dump arguments:
verissimo.sh -cmd my_compile.args -thread_dump_interval <milliseconds> -thread_dump_delay <milliseconds> -thread_dump_rules <rules>
The second way you can do this is by including this arguments in your ruleset.xml:
<ruleset version="2" name="#RULESET_NAME#" library="#LIBRARY_NAME">
  <configuration>
    <thread-dump interval="#THREAD_DUMP_INTERVAL#" delay="#THREAD_DUMP_DELAY#" rules="#THREAD_DUMP_RULE_NAME_1#,...,#THREAD_DUMP_RULE_NAME_N" />
  </configuration>
  ...
</ruleset>
The first thread dump is generated after the start of the rule with the specified delay. Subsequent thread dumps are generated periodically at the specified interval. The thread dumps are generated in the “profiling” subdirectory of your project folder.
How to generate a heap histogram dump for a Verissimo rule
There are two ways to generate histogram dumps for a rule. The first one is to run verissimo.sh with the histogram_dump_rules argument:
verissimo.sh -cmd my_compile.args -histogram_dump_rules <rules>
The second way you can do this is by including this argument in your ruleset.xml:
<ruleset version="2" name="#RULESET_NAME#" library="#LIBRARY_NAME">
  <configuration>
    <histogram-dump rules="#HISTOGRAM_DUMP_RULE_NAME_1#,...,#HISTOGRAM_DUMP_RULE_NAME_N" />
  </configuration>
  ...
</ruleset>
There will be two histograms generated: one when the rule starts and one when it finishes or when there is a memory warning issued, whichever happens first. The histogram dumps are generated in your project’s .dvt/profiling/verissimo/ directory.