
In today’s silicon-driven environment, writing register transfer level (RTL) or verification code is just the start; the fastest path to working hardware depends significantly on how efficiently you can edit, simulate, debug, and collaborate. This is where integrated development environments (IDEs) come in handy by streamlining everyday tasks across the design and verification flow. Choosing the right IDE can accelerate your bring-up schedule, uncover subtle bugs earlier, and help new engineers quickly navigate complex codebases.
In this article, we explain what an IDE is and how it can support hardware and verification engineers in their day-to-day tasks.
What Is an IDE?
An integrated development environment (IDE) for hardware design is a software application that combines key development tasks such as code editing, simulation setup, testbench creation, and debugging under one unified graphical user interface (GUI). It helps engineers work faster and with fewer errors by managing everything from hardware description language (HDL) source files to simulation and synthesis flows in a single place.
Key features typically include:
- Editors tailored for HDLs, with real-time syntax checking and autocomplete
- Code templates and quick fix suggestions
- Project navigation for managing files, modules, and IPs
- Build and synthesis automation
- Integration with simulators and external debug tools
- Waveform viewers for signal-level analysis
- Static analysis and linting support
Unlike general-purpose IDEs, hardware IDEs understand languages such asVerilog, SystemVerilog, VHDL, PSL, e, and SystemC, and connect seamlessly with EDA tools to streamline verification and debugging. IDE vs. Editor vs. Compiler vs. Simulator
The term “IDE” often gets mixed up with other tools in the hardware flow—such asa code editor, compiler, or simulator—but each serves a distinct purpose. Understanding these differences makes it easier to see exactly where an IDE fits in your design and verification process.
A code editor, such as Emacs, vi/Vim, VS Code, or Sublime Text, focuses on writing and navigating code. It may offer syntax highlighting and extensions, but it doesn’t manage builds or simulations on its own. Some editors, like VS Code, can mimic basic IDE functionality when extended with HDL plugins, yet full IDEs remain better suited for complex, integrated hardware workflows.
A compiler (along with the elaborator) translates your HDL source files into a form that can be simulated or synthesized. It’s the tool that actually builds your design.
A simulator, such as Questa, VCS, or Xcelium, runs your design over time to verify its behavior—often triggered from within the IDE.
An IDE ties all of this together by providing code editing, project organization, build orchestration, simulation setup, and debugging tools in one environment. When you hit “Run” or “Simulate” in an IDE, it calls the compiler or simulator in the background. In short, the editor is where you write code, the compiler builds it, the simulator runs it, and the IDE manages the whole flow in one place.
Why Are IDEs Important in Hardware Design and Verification?
In hardware design and verification, speed, accuracy, and coordination are critical. An IDE streamlines the flow from editing to simulation and debug, delivering clear benefits:
- Shorter feedback loops - An IDE flags syntax errors, SystemVerilog lint violations, and even simulation misconfigurations as you type. For example, a missing
endcaseor mismatched port width can be caught before you launch a regression run, preventing hours of wasted simulation time. - Faster debug - Waveform-linked navigation lets you jump from a failing check in a Universal Verification Methodology (UVM) test straight to the RTL process that generated the unexpected signal. This linkage removes the guesswork of tracing a bug across multiple tools.
- Simplified workflow - Instead of juggling a simulator console, Tcl scripts, multiple editors, and a waveform viewer, the IDE keeps the testbench, design, build flow, and debug environment in one place. This reduces mental context switching, especially valuable during crunch-time debug.
- Scalable project management - From a single IP block to a full system-on-chip (SoC), project hierarchies and dependency tracking help engineers navigate thousands of files without losing their place. For example, collapsing a hierarchy tree can instantly hide all lower-level modules until they’re relevant to the debug session.
- Team-wide alignment - Shared templates and version-controlled project files mean every engineer uses the same tool settings, compilation options, and lint rules. This consistency avoids “it works on my machine” problems, applies consistent rules across the project, and ensures review feedback applies across the team.
- Faster onboarding - A preconfigured workspace with HDL-aware navigation, lint rules, and simulator integration allows new hires to start editing and simulating within hours instead of days. They can use “go to definition” to explore unfamiliar SoC modules without manually tracing include paths.
- Support for modern workflows - Integration with continuous integration (CI) pipelines, containerized toolchains, and even AI assistants helps teams adopt shift-left methodologies. For example, a CI-triggered regression run can be launched directly from the IDE, with results linked back to the code changes that caused failures.
How an IDE Works
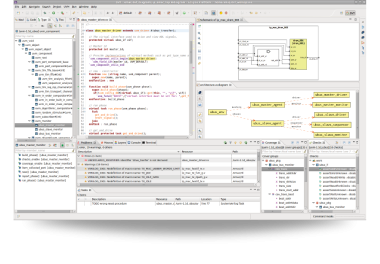
Modern hardware IDEs build on software IDE concepts but add features tailored to HDL design and verification. They typically follow a client–server model: you work within the GUI while background processes handle parsing, building, and debugging.
An HDL language server tokenizes and indexes your code, enabling cross-referencing, go-to-definition, and symbol search across hierarchies. The IDE also generates and manages simulation scripts, letting you launch builds, simulations, or regressions directly from the GUI.
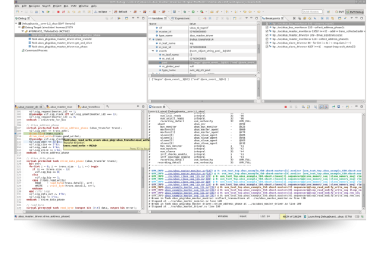
As you type, real-time static analysis flags syntax errors, lint violations, and synthesis issues inline. Built-in waveform viewers and source linking make it easy to jump between signal activity and the corresponding HDL lines.
Most hardware IDEs support plugins and APIs for specialized tasks such as protocol checking, visualization, or AI assistance, and they often integrate with version control and CI systems for consistent, automated workflows.
Challenges When Working with IDEs and How to Solve Them
While IDEs can greatly improve productivity in hardware development, they also bring unique challenges, especially when working with complex designs, mixed toolchains, and distributed teams.
- Resource intensity - Full-chip simulations, gate-level netlists, and large Fast Signal DataBase (FSDB) or Value Change Dump (VCD) waveform files can slow down workstations. Splitting simulations into targeted subsets or running them on farm/cloud servers keeps the GUI responsive.
- Licensing and cost constraints - Most hardware IDEs can call on licensed EDA tools such as simulators or synthesizers. If floating licenses are maxed out, engineers can be blocked mid-task. Regular license usage audits help ensure the pool matches team demand.
- Vendor lock-in - Some IDEs use proprietary project formats or deep tool integrations that make switching tools or automating flows difficult. Keeping compile and simulation scripts in a portable, tool-agnostic format (e.g., Make, CMake, or Python-based flows) protects your flexibility.
- Steep learning curve - UVM projects, mixed-language designs, and advanced debug features can overwhelm new users. Providing starter projects with pre-set compile orders, simulator bindings, and waveform setups helps flatten the curve.
- Toolchain drift - A project may suddenly fail because one engineer’s simulator patch differs from everyone else’s. Pinning simulator versions and tracking environment configs in version control ensures reproducibility across the team.
By treating key IDE settings as shared infrastructure, teams can minimize these risks and keep workflows smooth. At the same time, settings that reflect individual preference, such as dark mode, are user selectable.
Real-World Use Cases in HDL Design
Hardware IDEs become especially valuable during fast-paced or high-stakes phases of a project. Here's how teams typically use them:
- Debugging complex failures - When a bus signal toggles unexpectedly, cross-probing from the waveform viewer takes you directly to the HDL process or UVM sequence that generated it. This shortens the path from symptom to root cause, especially in designs with deep hierarchies.
- Regression triage - Overnight regressions often fail for subtle reasons—an assertion trip, a handshake timing shift, or a coverage hole. In the IDE, you can compare waveform snapshots, inspect failing conditions, and narrow your investigation to just the changed code regions. This focused approach saves hours when reviewing large regression logs.
- Aligning testbenches with designs - In complex UVM environments, transactions may pass through multiple drivers, monitors, and interfaces before reaching the design being simulated. The IDE’s semantic search and cross-referencing let you follow that path step-by-step, linking each transaction back to the exact HDL module being stimulated.
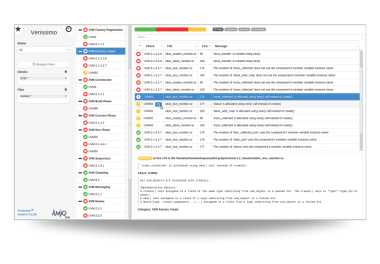
- Closing lint and coverage gaps - Lint violations appear inline, allowing you to correct or waive them without leaving the editor. For coverage closure, the IDE highlights untested blocks or constraints and links them to the relevant simulation bins, so you can add targeted tests and immediately re-run simulations.
- Onboarding new engineers - Exploring a multi-million–gate SoC can be overwhelming without guidance. Hierarchy views, “go to definition” navigation, and inline documentation help new team members understand how modules and packages fit together before making changes.
- Collaborative review - Code reviews often involve more than just text diffs. In the IDE, reviewers can see HDL changes alongside waveform updates, coverage impacts, and regression results, making it easier to evaluate both functional and verification consequences in one place.
How DVT IDE Extends and Optimizes Hardware IDE Workflows
For engineers working with hardware IDEs, AMIQ EDA’s DVT IDE offers a feature set that directly addresses common bottlenecks in HDL workflows.
Unlike generic editors that simply highlight keywords, DVT IDE uses an IEEE-compliant compiler to parse HDL code in real time. This means errors, such as mismatched port widths in SystemVerilog or missing end statements in VHDL, are flagged immediately, without requiring a separate simulation run. Combined with intelligent autocomplete, quick fixes, and refactoring tools, this shortens the feedback loop and keeps iteration fast.
Navigation in large projects is another area where DVT IDE stands out. Whether tracing a UVM sequence through drivers and monitors, or following a signal across multiple RTL modules, semantic search and cross-referencing keep you oriented. Structural browsing and auto-generated diagrams make it easier to align testbench components with the DUT, even in SoC-scale designs.
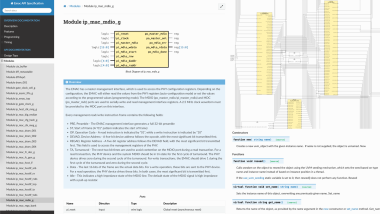
By combining these capabilities, DVT IDE doesn’t just act as an editor–it becomes a central platform for navigating, debugging, enforcing standards, and documenting complex HDL projects.