
DVT Debugger
Simpler and faster code debugging for hardware design and verification engineers using Verilog, VHDL, SystemVerilog, and e Language.
DVT Debugger is an add-on module to DVT IDE for Eclipse. It integrates with all major simulators and provides advanced debugging capabilities.
Makes it easier to find and fix code issues.
Enhances the debugging context.
Speeds up bug diagnosis.
Eliminates unnecessary annoying operations.
DVT Debugger is unique because it allows you to debug from the same place where you develop code, whether it’s Verilog, SystemVerilog, VHDL, or e Language. It practically eliminates the need to continuously switch between the editor - to understand the source code, and the simulator - to inspect variable values and set, enable, and disable breakpoints or advance the simulation.
Deploying the debugger requires minimal simulation flow changes. You can launch the simulation in debug mode and specify the DVT communication library using simulator-specific arguments. DVT IDE for Eclipse ships with debugger configuration examples that help with deployment.
The simulator communicates with DVT IDE for Eclipse through network sockets. You can connect to a simulation running on another machine, for example from a "GUI jobs" machine to a more powerful "batch jobs" machine that executes the simulation. It is also possible to connect from a machine on which the source code is available to a machine on which the source code is encrypted.
Key Features
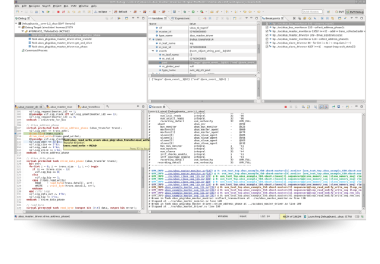
- The DVT Debug Perspective is a GUI layout focused on debug-specific activities for major HDLs and HVLs, such as Verilog, SystemVerilog, VHDL, and e Language. It provides simulation controls like step over, step into, or resume. It also shows the simulation context in the Editor and several dedicated Views.
- The Breakpoints View enables you to quickly inspect all breakpoints, enable or disable a specific breakpoint, or define conditional breakpoints.
- The Debug View is always connected to the editor, allowing you to move up and down the call stack and see the active line corresponding to the stack frame where the simulator stopped.
- The Variables View displays the variables associated with the stack frame selected in the Debug View such as the arguments of the current function, locally declared variables, class members, and module signals. You can change a variable value at runtime from this view.
- The Expression View permits you to define and watch expressions. You can inspect a complex expression by selecting it in the editor and then adding a watch to the Expressions View.
- The Console View shows the simulation output and it allows you to enter simulator commands.
- Double click to add a breakpoint at a specific line in the DVT IDE for Eclipse's editor. Whenever the simulator hits a breakpoint, the editor highlights the corresponding line.
- Hover a variable name to quickly see the runtime value in tooltip.
Why choose DVT Debugger
- Debug from the same place where you write code. Commonly used debug operations like adding breakpoints, stepping, moving up and down the call stack, or changing values are just a click away in DVT IDE for Eclipse.
- Avoid unnecessary printing or other additional commands because the run-time context is automatically fetched from the simulator. The call stack and local variables are available to be analyzed anytime the simulator hits a breakpoint.
- Take advantage of all DVT IDE for Eclipse's features that help navigate and understand the code while debugging: hyperlinks, hierarchy browsing, finding usages or tracing, and many others — providing seamless context across Verilog, SystemVerilog, VHDL, and e Language projects.