Views
Code Templates View
The Code Templates is located near the Navigator and Hierarchy views or you can open it from .
To insert a template in a code editor, you can either:
drag and drop it in the editor at a specific location
double click on it
click on Insert into editor button
right-click on it > Insert
Note
If you choose one of the last three actions mentioned above, the template will be inserted in the current editor at the current cursor’s positon. Please make sure you have an opened editor and the cursor is at the right position before adding the template!
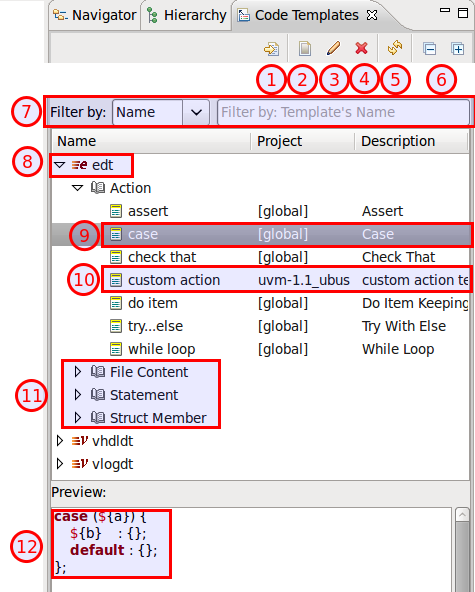
Insert the selected template into the current editor
Create a new template
Edit the selected template
Remove the selected template (NOTE: you cannot undo this operation!)
Refresh the view (if it doesn’t automatically update when you modify templates/projects etc.)
Collapse/expand all
Filter templates (you can filter them by: nature, context, name, project, description)
Templates’ natures
Templates’ contexts
Preview the template’s pattern (it automatically updates when clicking on a template)
To create a new template, click on Create a New Template button on the toolbar:
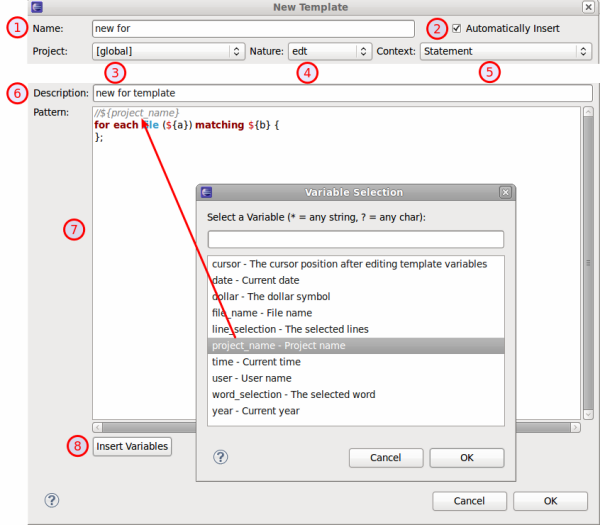
Template’s name
Check Automatically insert if you want the template to expand automatically on Ctrl+Space when there is no other matching template available. It is usually good idea to leave the checkbox checked, otherwise you would get a template proposal “popup”
Each template must be created under a project available in the current workspace (select [ global ] for a global template)
Assign a nature - only natures relevant to the selected project will be displayed
Template’s context - only contexts relevant to the selected nature will be displayed
Templates’s description
Code Pattern - embed variables in ${} e.g. ${variable_name} to enable the template proposal wizard when inserting the template into an editor
Insert variables - here you can find some useful misc. predefined variables
Compile Order View
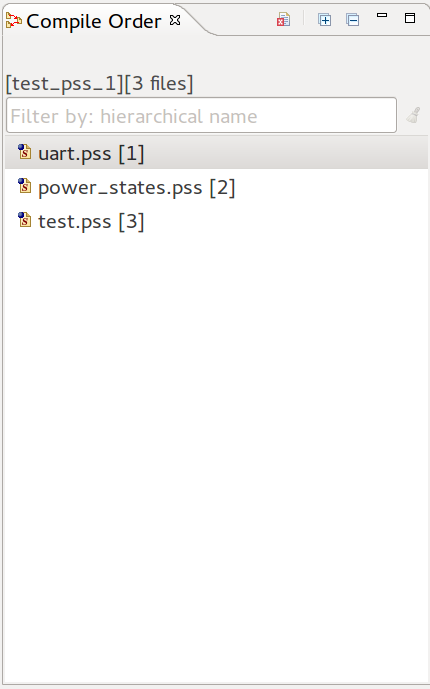
The Compile Order View presents the hierarchy of compiled files as it results from the `include compiler directives, starting from the project top files.
Open the view from menu .
Double click on a file to open it.
You can use CamelCase or Simple Regex to locate a specific element.

|
A file in your project. |
Build Config Hierarchy
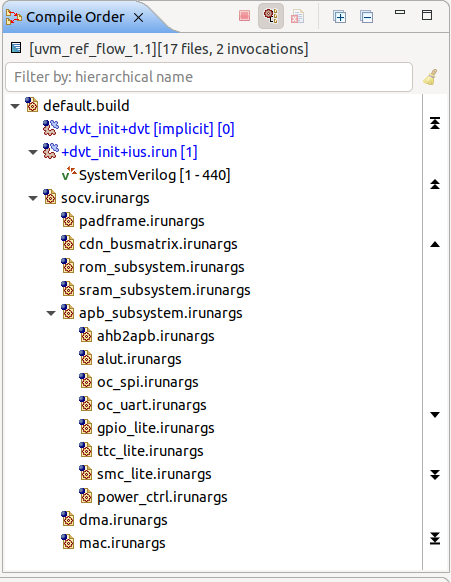
Press Show Build Config button to open the build config hierarchy as it results from the ‘-f’ compile directives, starting from the active build configuration.

Note
Each invocation section will be added under the coresponding build configuration file.
Quick Compile Order View
Press Ctrl+I to quickly open a compiled file.
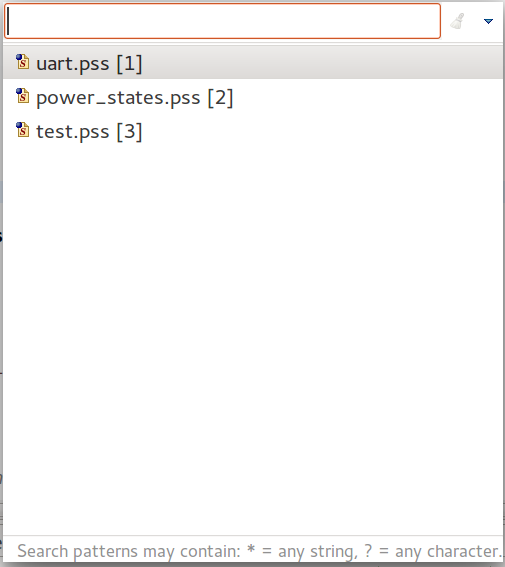
The Quick Compile Order View will pop-up and and present a filterable list of all the compiled files in the project.
You can use CamelCase or Simple Regex to locate a specific element.
Select a file and press Enter or click to open it.
Console View
Any invocation (for example a DVT Generic run) output is dumped to the Console View.
The Console View is automatically raised at any invocation.You can also go to menu to open the Console View.
Click on hyperlinks in the Console View to jump directly to the to source location.
Coverage View
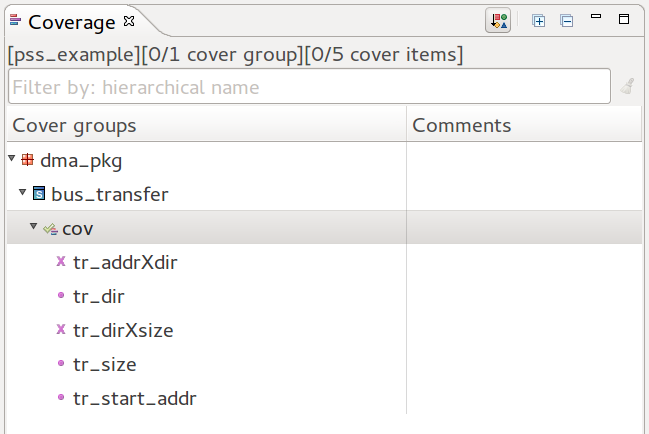
The Coverage View presents all the coverage groups and items in your project.
Open the view from menu .
Double click on a group or item and jump to the source location.
You can use CamelCase, Simple Regex or Hierarchical Search to locate a specific element. By default, hierarchical search will show all descendants

|
cover group |

|
simple item |

|
cross item |
Inspect View
Inspect View shows detailed information about various elements in DVT.
Open the view from menu .
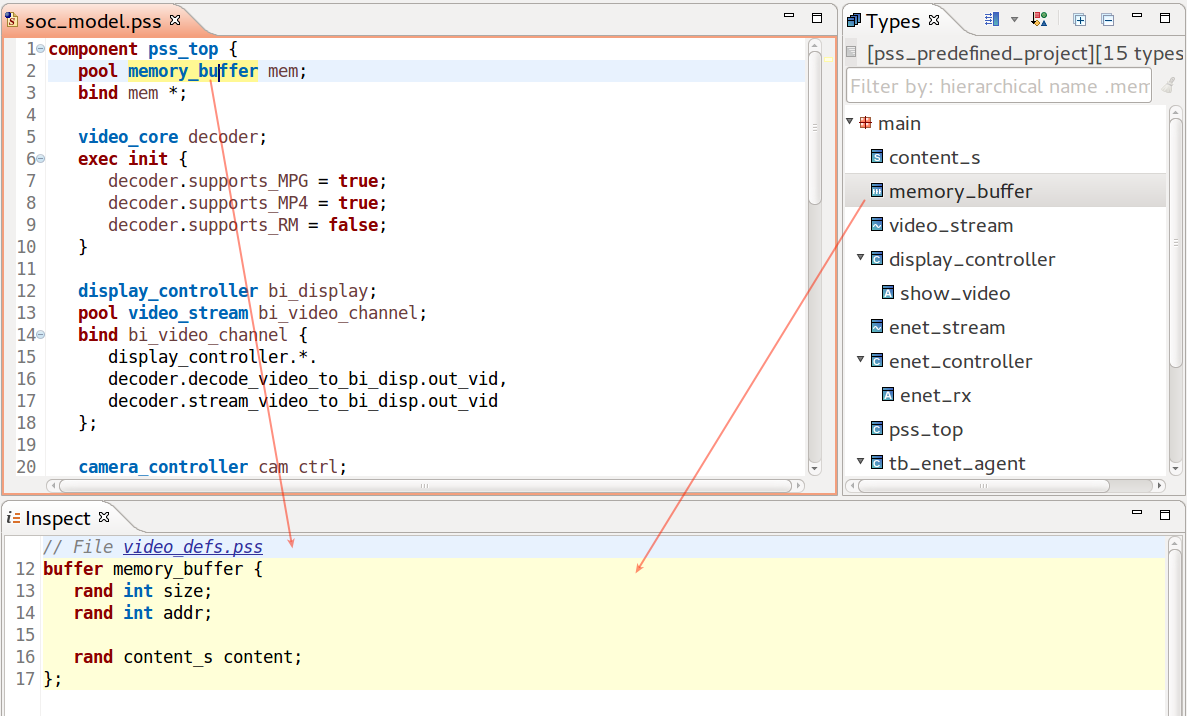
To inspect an element, simply select it in a view or click on its name in the editor.
Information about the selected element will be presented in the view.
Each element shown in the Inspect View starts with an information line regarding the file and line number of the element.
The Inspect View highlights the relevant source code lines of the selected element. These lines may be surrounded with additional source code to provide a context, if necessary.
You can customize the number of lines shown by going to , or by using the key mappings detailed in the ‘’’Hotkeys’’’ chapter below.
Hotkeys
The following key mappings are available while interacting with the Inspect View.
CTRL+ALT+[ |
Decrease the number of context lines shown |
CTRL+ALT+] |
Increase the number of context lines shown |
CTRL+K |
Cycle through highlighted inputs shown inside the view |
WaveDrom Timing Diagrams
WaveDrom is a tool that draws timing diagrams (waveforms) from a simple textual description written in JSON. DVT renders WaveDrom waveforms in the Inspect View. The waveform diagram is updated on the fly (as you type).
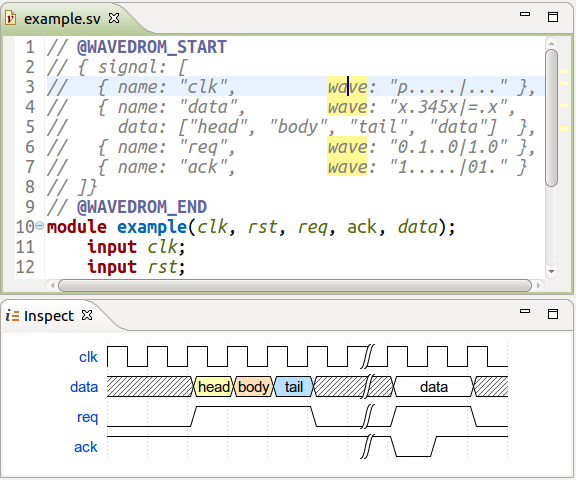
The waveform description can be:
either embedded in comments, surrounded by @WAVEDROM_START…@WAVEDROM_END pragmas
or in files with *.json or *.json5 extensions
When the waveform description is found in a file with a valid extension, the Inspect View will process it’s content and render the diagram when opened. The waveform description file can also be embedded in comments using the @WAVEDROM_FILE pragma, followed by its location. The location of the file will be solved relatively to the project root.
To save the diagram as an SVG file, right-click on it in the Inspect View.
DVT offers the ability to view WaveDrom diagrams through tooltips, by hovering over any waveform written inside DVT editors.
Tip
The WaveDrom documentation is available here.
Note
To specify additional file extensions, use the +dvt_wavedrom_file_ext_add+<extension> build config directive. To clear the extensions list use +dvt_wavedrom_file_ext_clear.
Note
To specify additional search file locations to use in junction with @WAVEDROM_FILE pragma, use the +dvt_wavedrom_files_location_add+<location> build config directive. To clear the extensions list use +dvt_wavedrom_files_location_clear.
Note
By default, only waveform descriptions of maximum 5000 characters are rendered. You can change this threshold from menu Window > Preferences then DVT > Editors.
Note
DVT uses WaveDrom version 3.5.0.
Layers View
Composite and enumerated types in PSS are extensible, hence the definition of some entity might end up being spread over multiple regions in one or more files.
The Layers View provides a compact presentation of all the extensions (layers) of a specific entity. The layers are in the compilation order.
Place the cursor on the entity name and press Shift+F3 or right click and chose from the editor context menu. The Layers View is automatically raised at any invocation. You can also open it from .
Double click on a layer and jump to the corresponding source location.
Right click on a layer to Show Type Hierarchy, Show Usages, etc.
You can use CamelCase or Simple Regex in the quick search bar to query the layers.

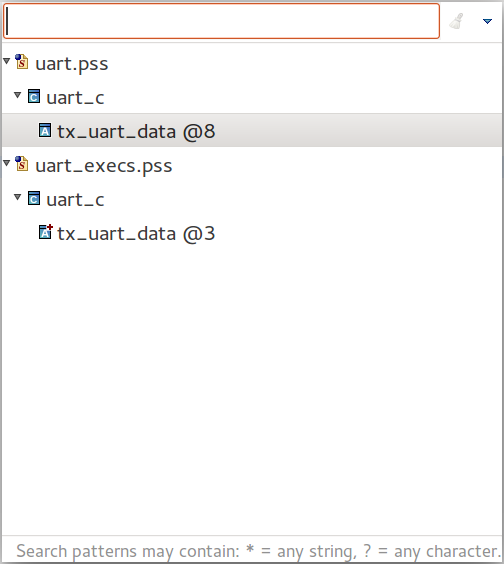
Quick Layers View
Position the cursor on the element’s name and press Ctrl+Shift+O.
The Quick Layers View will pop-up and present a filterable list with all of the selected element’s layers.
You can use CamelCase or Simple Regex to locate a specific element.
Select a layer and press Enter or click to jump to the corresponding source location.
Outline View
The Outline View presents an overview of the editor contents.
Open the view from menu Window > Show View > Other… > General > Outline.
You can click on an entity to jump to its location inside the current file.
You can use CamelCase or Simple Regex to locate a specific element.
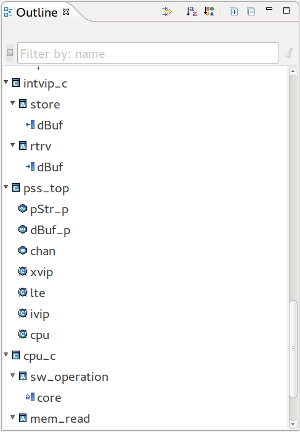

|
Filters… |
Select what elements to show |

|
Alphabetical Sort |
If alphabetical sort is on, all the entities are sorted by name. By default the entities are presented in the definition order. |

|
Category Sort |
If category sort is on, entities are arranged by categories (fields, methods etc.), instead of being mixed as they appear in the file. |

|
Expand All |
|

|
Collapse All |
Quick Outline View
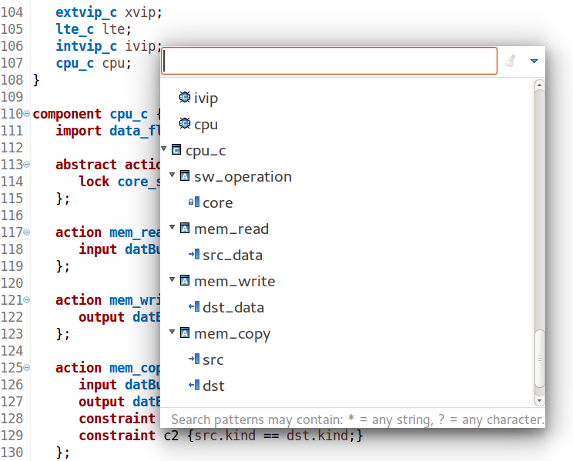
Press Ctrl+O to open the Quick Outline dialog. It presents an overview of your file.
You can use CamelCase or Simple Regex to locate a specific element
Outline View Preferences
You can configure the Outline View contents from menu .
Problems View
If a project contains errors, for example syntax errors, it will be indicated using decorators
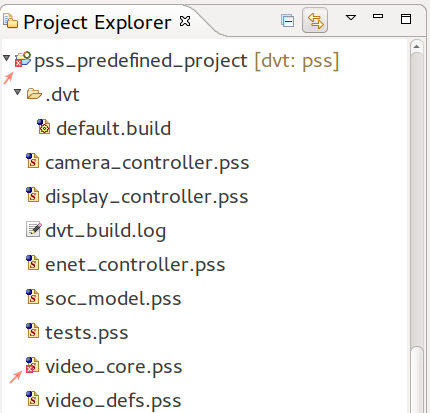
You can use the Problems View to inspect the errors. Open the view from menu . Double clicking on some error will jump to the source location.

Quick Query View
Press Ctrl+Alt+Q to quickly open the Quick Query View, which provides a filterable list of all the types and compiled files in the project.
This view supports semantic search, allowing to look for a specific element. In order to do this, structure your query in the following manner: query_key:search_pattern.
You can use CamelCase or Simple Regex for the search_pattern.
Tip
Use Content Assist to see all the available query keys (CTRL+Space).
DVT supports the following query keys:
action
buffer
component
enum
file
package
resource
state
stream
struct
type
typedef
Note
You can use the type:search_pattern query in order to search for all the types (actions, components etc.) defined in your project.
Select an element and press Enter or click to navigate to it.
Note
By default, the Quick Query View will display 100 items from each category (types, files). You can customize this value by going to .
Tasks View
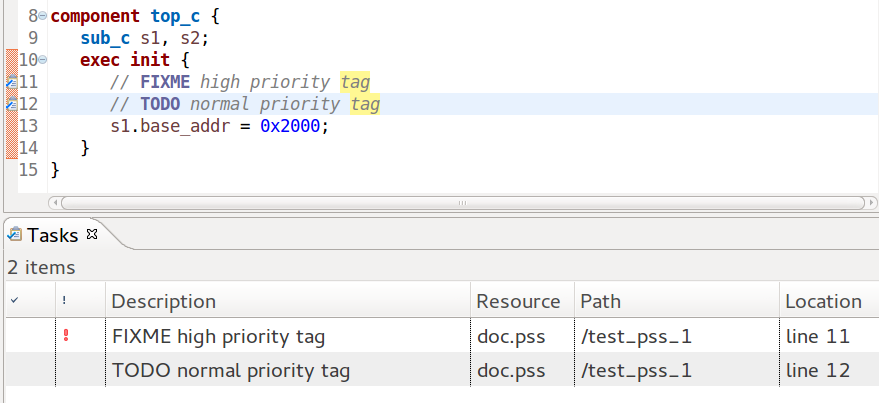
You can embed reminders in your source files by adding comments prefixed by certain “keywords” called task tags.
There are three predefined tags:
FIXME - high priority
TODO - normal priority
XXX - low priority
All reminders are listed in the Tasks View. If it is not visible, open the view from menu .
Double click on a task to jump to the marker definition.
You can define custom reminder tags and assign them priorities:
Navigate to
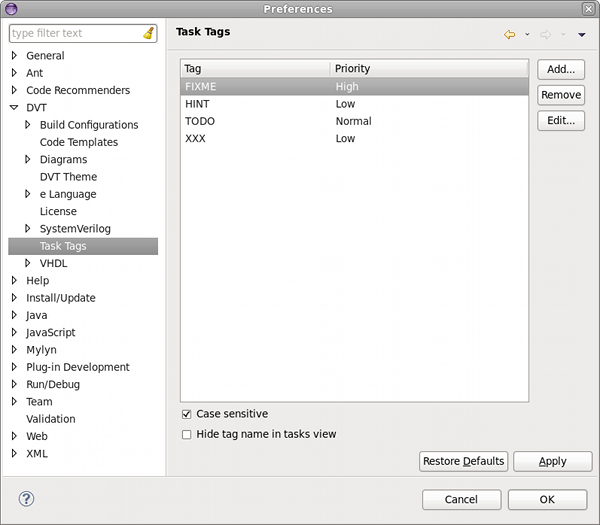
You can specify if the tags should be considered case-sensitive and if the tag name should be displayed in Tasks View.
Click the Add… button on the right, enter the name of your tag and select its priority
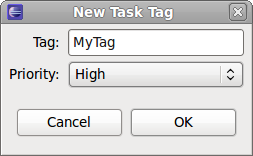
Click OK in the New Task Tag and Preferences dialogs
DVT will recognize the new tag and highlight it in code comments.
Note
It is recommended to rebuild the project so that DVT rescans all files for reminders.
Types View
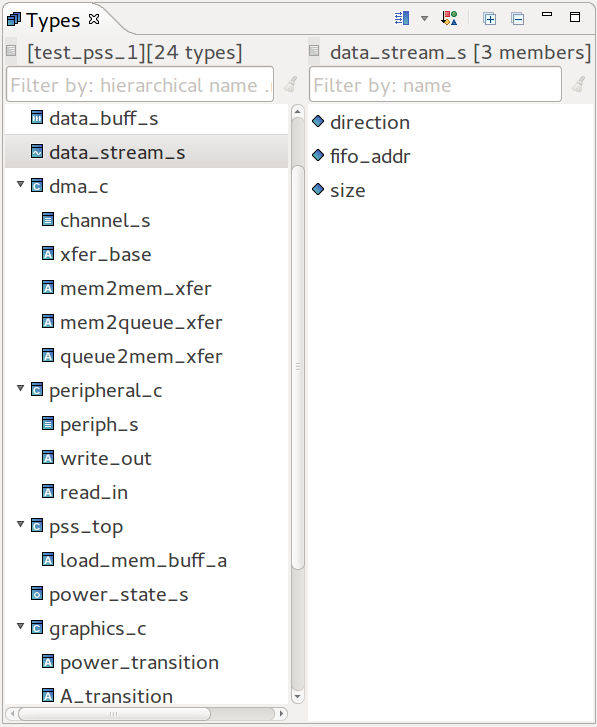
The Types View presents all the types (classes, structs, units, entities etc.) defined in your project.
Open the view from menu Window > Show View > Other… > DVT > Types.
Click on the Show Members button to show the Members pane.
Double click on a type or type member to jump to its definition.
Right click on a type or type member to search for Search for References (Usages) or further inspect the Type Hierarchy View or the Verification Hierarchy View, where applicable.
You can perform Search for Members.
Toolbar |
||
|---|---|---|

|
Show/Hide Members |
Toggles the visibility of the members pane. Use the drop-down to chose placement (to the right side or below the types tree). |

|
Sort by Category |
Click to sort by category. Default sort order is alphabetical. |

|
Expand All |
Expand all nodes in types tree. |

|
Collapse All |
Collapse all nodes in types tree. |
Note
Type containers are also shown in the view, for example libraries, generate statements, etc. See this for more information on Types, Type Containers and Type Members.
Quick Types View
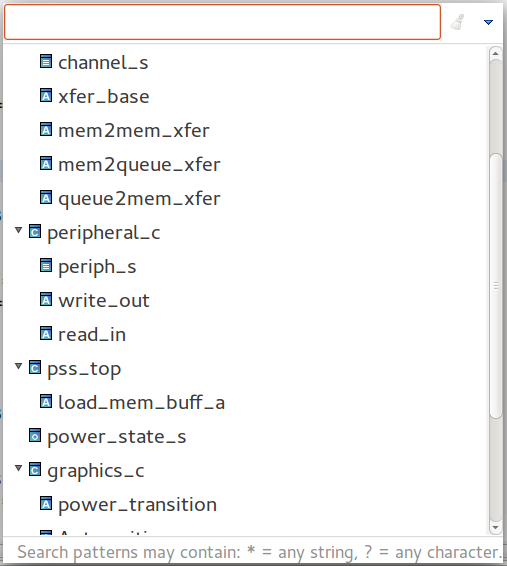
Press Ctrl+Shift+T to quickly open a specific type definition for the project associated with the active editor or the current selected project from the Navigator (if no editor is open).
The Quick Types View will pop-up and and present a filterable list of all the types in the project associated with the active editor or the current selected project from the Navigator (if no editor is open).
You can use CamelCase or Simple Regex to locate a specific element.
Select and press Enter or click to jump to its definition.
Type Hierarchy View
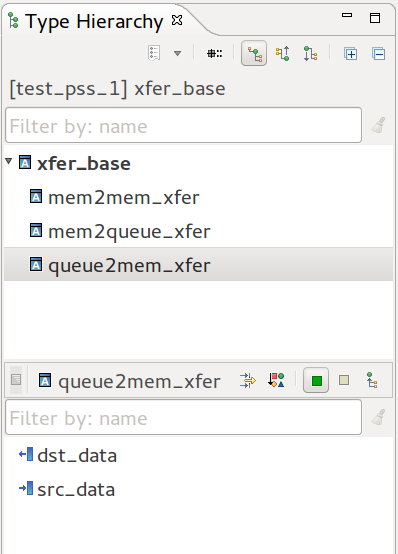
The Type Hierarchy View presents the OOP inheritance and members of composite types.
Position the cursor on the element name and press F4 or right click and choose Type Hierarchy from the menu.
The Type Hierarchy View is automatically opened at any invocation. You can also open it from .
You can use CamelCase or Simple Regex to locate a specific element.
Quick Type Hierarchy View
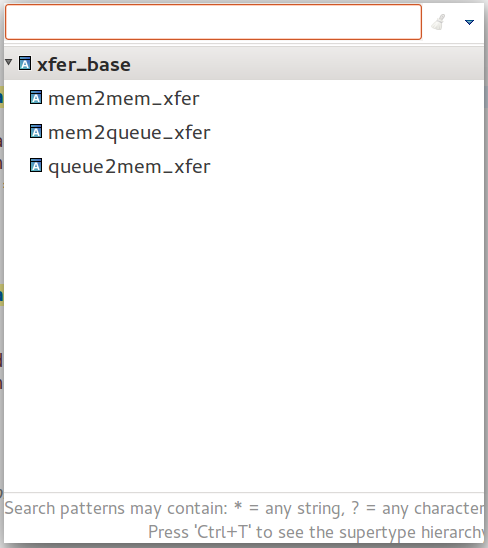
You can quickly inspect and jump to a specific parent or child in the hierarchy. Press Ctrl+T with the cursor positioned on the element name.
The Quick Type Hierarchy View will pop-up and present a filterable list with all of the selected element’s hierarchy.
You can use CamelCase or Simple Regex to locate a specific element.
Select and press Enter or click to jump to the corresponding source location.
Tip
While the Quick Type Hierarchy View is open you can press Ctrl+T to switch between Full type and Supertype hierarchy.
Verification Hierarchy View
The Verification Hierarchy View presents the component instance tree including pools.
Click the  select top button to select a top component. From the editor place the cursor on the name of a component and press Shift+F6 or right-click and choose from the context menu.
The Verification Hierarchy View opens with the chosen component set as the top of the hierarchy. You can also go to Window > Show View > Verification Hierarchy to open the view.
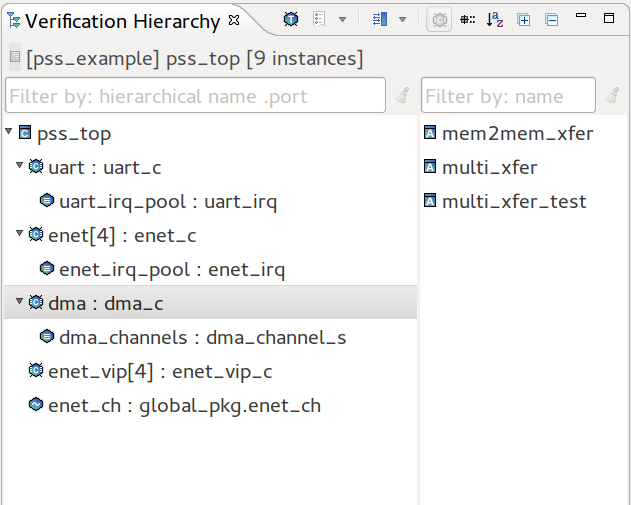
 Select Top A drop-down menu/pop-up dialog to select from top components. A top component instantiates other component and it is not itself instantiated. For example, the component pss_top.
 History List Click to see the previously inspected tops.
 Show/Hide Actions Shows or hides the actions of the selected component. You can set the actions panel to the right or below the hierarchy.
 Alphabetical Sort Sort instances and actions alphabetically. By default it is off, which means that the instances and the actions are presented in their declaration order from the source files.
The view label shows the current project, the current top component and the number of instances in the hierarchy.
You can use the quick filter bar to locate a specific instance or action. See Quick Search in Views for more details.
You can double-click on any component or on any action to go to its declaration.
Right-click on a component instance in the hierarchy and you have the option to search for its usages, to open its declaration.
Right-click on an action and you have the option to search for its usages, to show its layers, to show its type hierarchy.