Trace Connections View
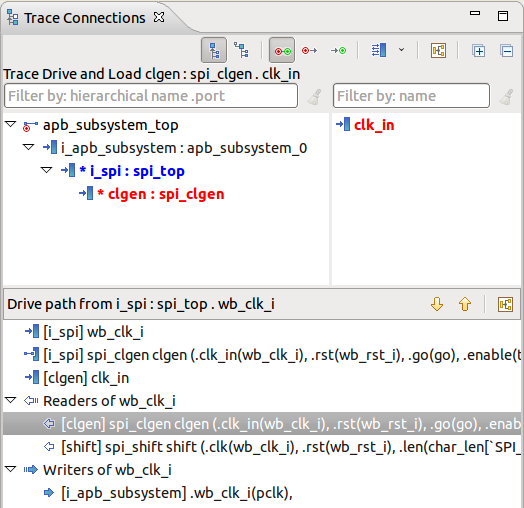
The Trace Connections View presents a hierarchy similar with the Design Hierarchy View:
The connected instances are displayed, the rest are filtered out.
You can use Show Root and Show Full Hierarchy options to show the entire design. The connected instances are colored, the rest are grayed-out.
Port icons indicate the direction of the signal.
Sources and destinations are marked with red/green decorations.
You can search for a specific connected instance or signal with Quick Search.

The toolbar buttons allow you to change the trace kind:
 Trace Drive and Load shows the connected instances across the drive and load paths (how is this signal connected in the design?).
 Trace Drive shows the connected instances across the drive paths (who drives this port?).
 Trace Load shows the connected instances across the load paths (who does this port drive?).
Other buttons:
 Show Root shows the path to the hierarchy root, even if the signal doesn’t reach it. It provides the enclosing context for deep traces, for example when tracing a signal many levels below the top module. This option is enabled by default.
 Show Full Hierarchy shows the full hierarchy, whether it is reached by the traced signal or not (how is this signal connected in the whole design context?).
 Show As List to view only the sources and destinations as a list.
 Show/Hide Signals shows or hides the ports or internal signals of the currently selected instance.
 Show Diagram to view a graphical representation of signal traces.
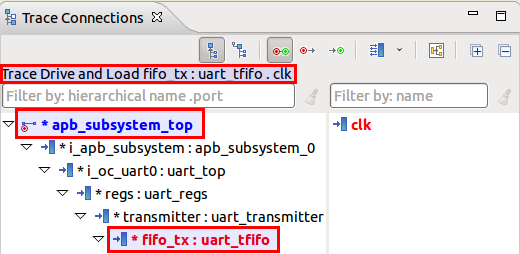
At any time you can see the traced signal (the port or internal signal you are currently tracing). It is indicated in the info label. The two connected instances that are bold colored in the tree represent:
The instance with the traced signal.
The instance with the signal shown in the trace path. More details here.

Double-click on an element to go to code:
For a connected instance, go to its declaration.
For a port, go to where it is connected in the trace path.
For a signal, go to where it is declared.
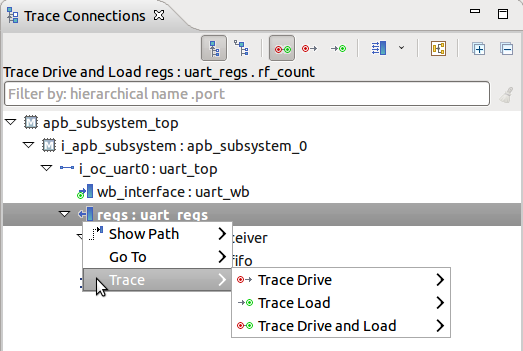
When the signals panel is hidden, right-click on an instance in the tree to show the context menu.

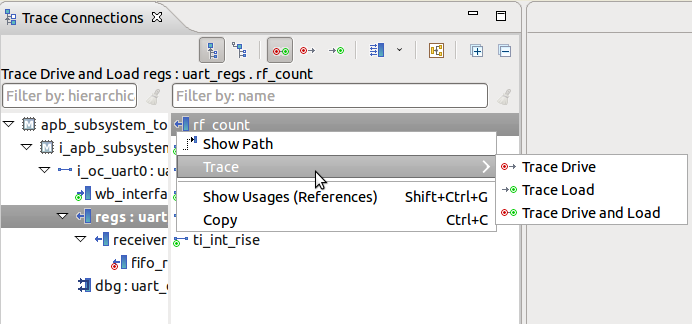
When visible, right-clicking on a port or internal signal to show the context menu.

The options in the context menu are :
Trace > trace kind Trace signals found on the drive or load paths of the current traced signal.
Go to Go to the port connections or signal declarations of the selected instance. The same as double-clicking on a particular signal in the signals panel.
Show Path Show the trace path from the traced port to the selected port or internal signal. More details here.