Design Diagrams
Design Diagrams help you inspect and document the structure of a design element.
You can create a design diagram in one of the following ways:
Right click in the Types View or the Design Hierarchy View and select Show Diagram.
Place the cursor over a type, instance or state variable in the editor, Right-Click and select Show > Diagram.
Schematic Diagrams
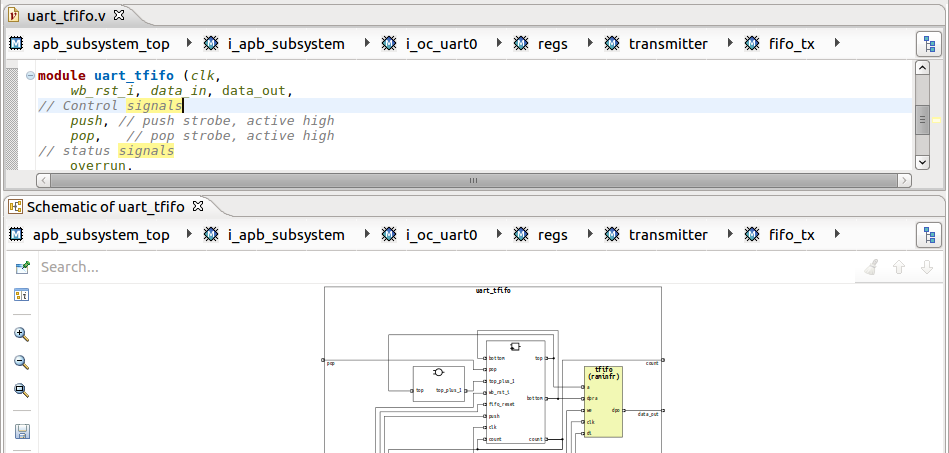
By default Show Diagram opens a schematic diagram that presents the internal structure: ports, sub-instances, combinational and sequential logic and connections.
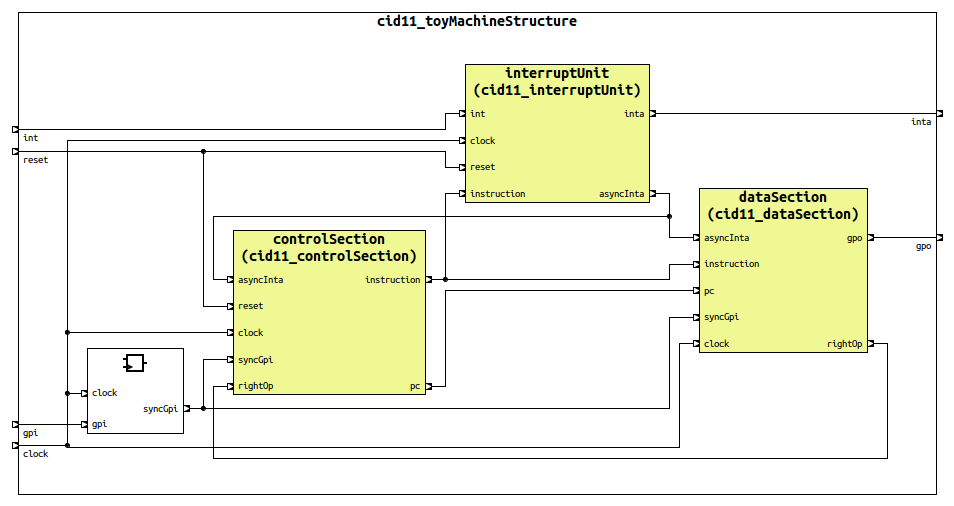
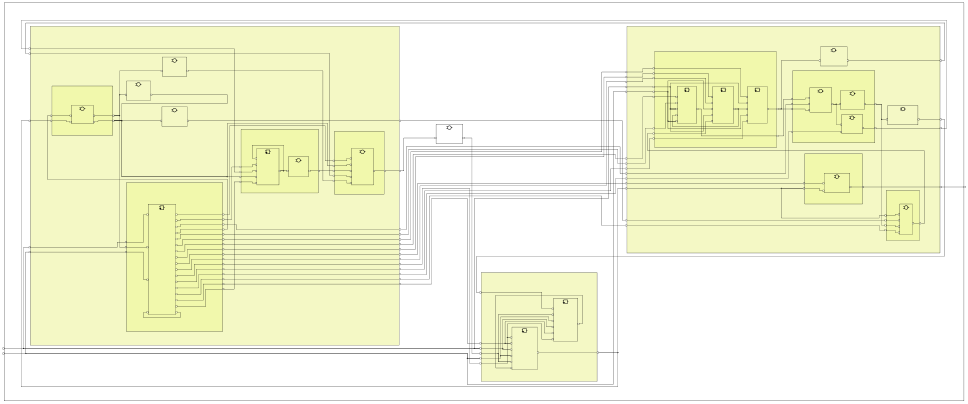
You can draw a nested schematic by increasing the depth from the diagram preferences.
Flow Diagrams
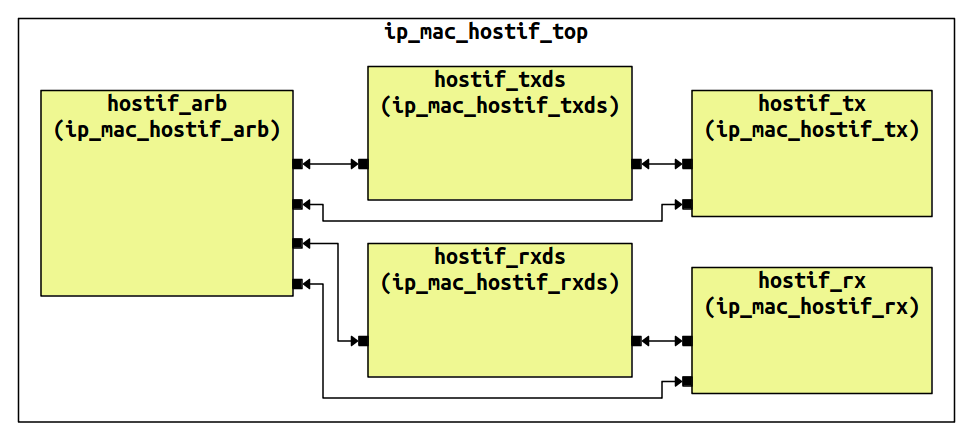
A flow diagram presents a high level view of internal connectivity. Multiple connections from one instance to another are collapsed in a single directional edge.
Transform a schematic into a flow diagram using the preferences from the Diagram Toolbar.
Block Diagrams
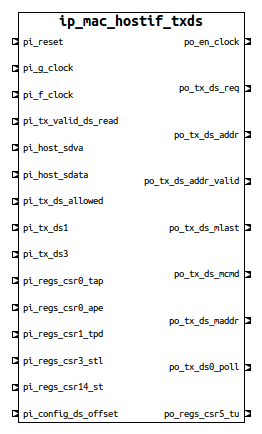
A block diagram presents the ports.
Transform a schematic into a block diagram using the preferences from the Diagram Toolbar.
Finite-State Machine Diagrams
Show Diagram on a state variable inside a module or entity will generate a Finite-State Machine (FSM) diagram. States and transitions are automatically detected by analyzing all the assignments and conditions in which the state variable is used.
Multiple transitions between the same two states are merged into a single one with multiple conditions.
Next state variables are supported. The “one-hot” case item pattern is supported. Method call transitions are not supported.
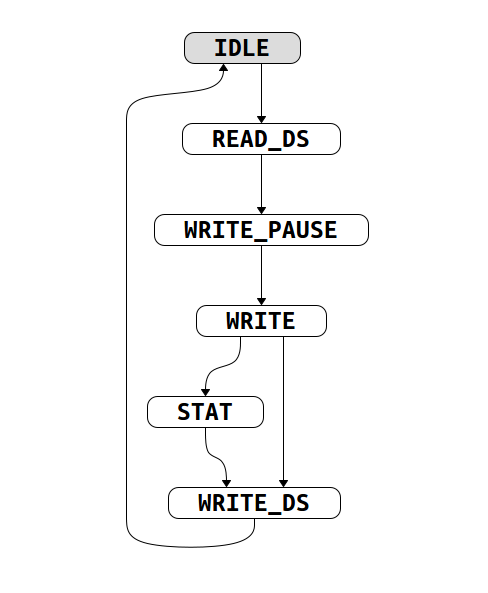
The initial state is colored gray.
Selecting any state or transition will highlight the previous and next states differently.
You can change the look and feel of the diagram using the preferences from the Diagram Toolbar or you can change the default preferences from .
Graph Direction The direction of the diagram.
Placement Strategy The algorithm used for placing blocks and edges.
Opposite In/Out Edges for For which states should incoming and outgoing edges be constrained to opposite sides? The default is All States except Initial.
Initial State Position The position of the initial state relative to the graph direction. The default is First.
Show Explicit Loopback Edges Show explicit transitions to the same state as a loopback edge.
Transition Labels The label displayed on transitions. It can be the Index of the transition or the Condition (merged transitions will have multiple conditions). The default is None.
Hide names in conditions A list of signal names that will be filtered out of conditions. Strict text matching is used.
Hide common expressions in conditions Expressions that are occurring in every transition will be filtered out of conditions.
You can inspect transitions in the diagram table. Select any entry in the table and the transition will be highlighted in the diagram. Any selection in the diagram will highlight the corresponding elements in the table.
Tip
The transition table can be copied to system clipboard, by using the Copy Table As option from the table Context Menu.
This action can be also triggered on the some specific transitions using the Ctrl+C shortcut.
The conditions for all transitions are presented in the last column.
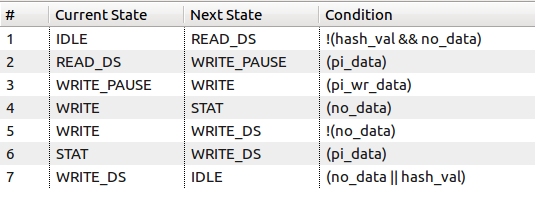
Diagram Filters
Note
Filters only apply to Schematic and Flow diagrams.
You can customize the diagram using the Filters button  in the diagram editor toolbar.
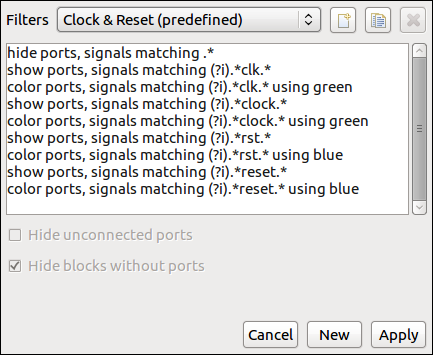
Use the drop-down menu at the top of the dialog to select from available filters.
Use the buttons in the top-right corner of the dialog to create, duplicate, or delete the current filter.
Use the checkboxes at the bottom of the dialog to further clean up the diagram.
A filter is defined using filter rules (one per line). The general form of a filter rule is:
command element_kinds matching regex [using color_name_or_code]
command is one of hide, show, or color
element_kinds is a comma-separated list of kinds. The available kinds are blocks, instances, types, signals, ports, input ports, output ports, and inout ports
regex is a regular expression that matches the relevant diagram element labels
color_name_or_code is a color specified by name, 6- or 3-digit hexadecimal code, comma-separated decimal RGB code or the keyword random. This is relevant only for color rules.
Tip
You can use content assist to write the filters (CTRL+Space).
To apply a filter rule only to elements under a specific instance, you must provide the relevant path in the regex section of the rule:
a path must always begin with the name of the top instance (or module) in the diagram (if instance is under top_instance, then top_instance/instance/… is valid, while instance/… is not)
a path consists only of names of instances (with the possible exception of the top module) and “/” (i.e. you can’t use the module name in a path except if the diagram top is a module, and not an instance)
each level is separated from the previous using “/” (valid: top_instance/inst1/inst2/…; not valid: top_instance.inst1.inst2…)
regular expressions may be used in the path section of a rule (for example, top_instance/.*/some_instance)
if the regex contains “/”, everything before the last “/” is the path, the rest is used to match the relevant diagram elements (in the following example, the bolded text is the path: top_instance/.*/inst1/.*clk.*)
if the regex does not contain “/”, it applies to all elements of the appropriate element_kinds
Tip
You can hide the hierarchy under an instance with the filter “hide blocks matching path/to/instance/.*”.
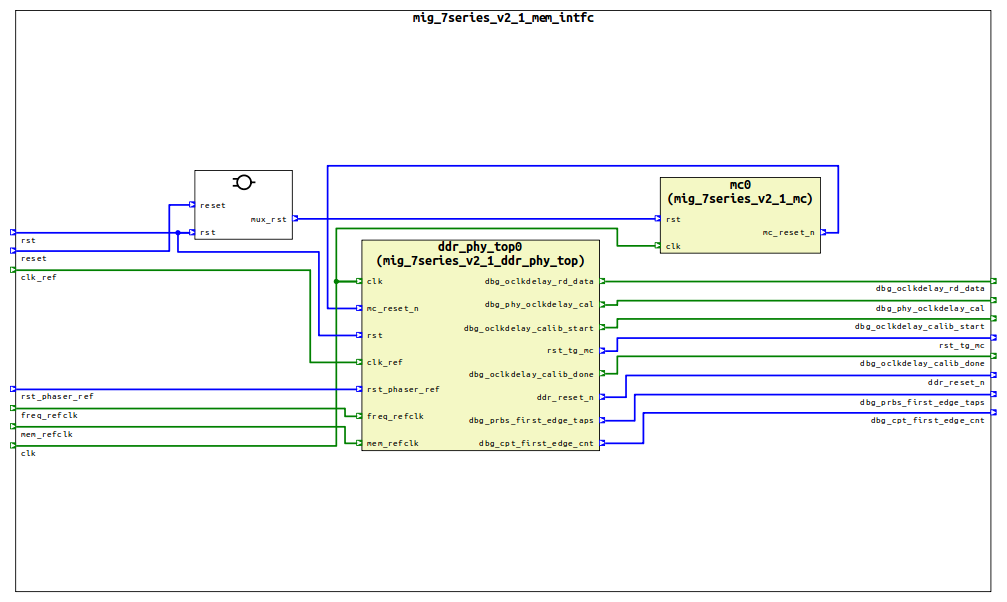
With the predefined filter in the image above, the resulting diagram will be similar to the following:
Design Diagram Actions
Design Diagram actions are available in the Right-Click context menu.
Action |
Diagram kind |
Element kind |
Description |
|---|---|---|---|
Go to Source |
Block
Flow
Schematic
FSM
Supply Network
|
ALL |
Jump to the selected element source code (instances, state values, ports, power domains, connections, state transitions). 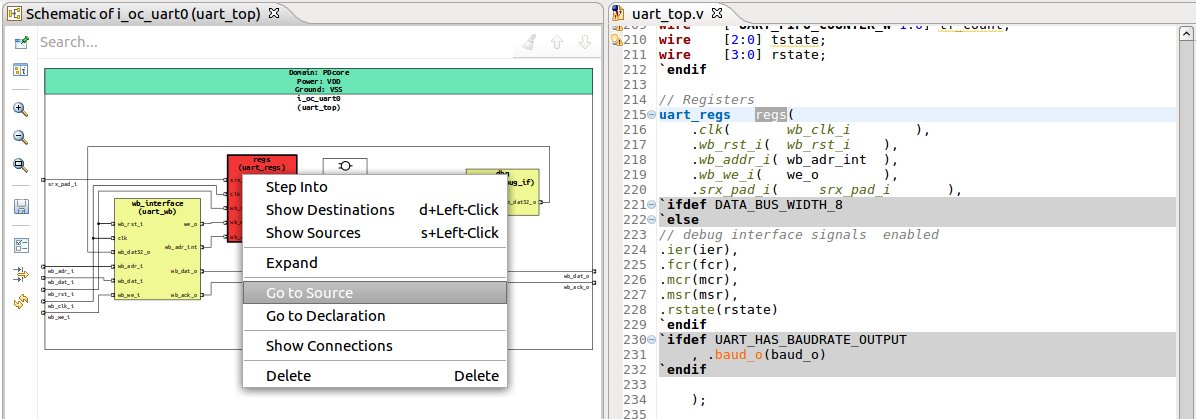
|
Go to Declaration |
Flow
Schematic
|
Instance |
Jump directly to the module or entity declaration. 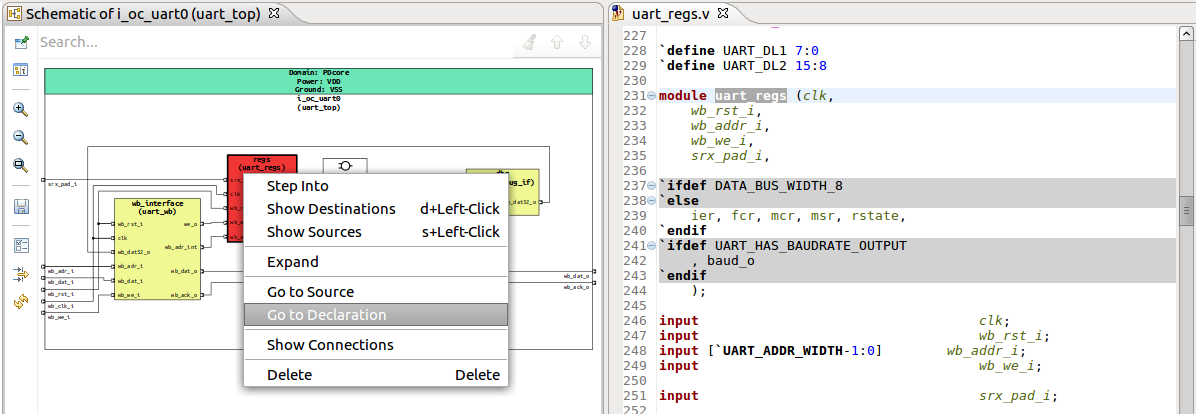
|
Step into |
Flow
Schematic
|
Instance |
Show the diagram for the selected instance. 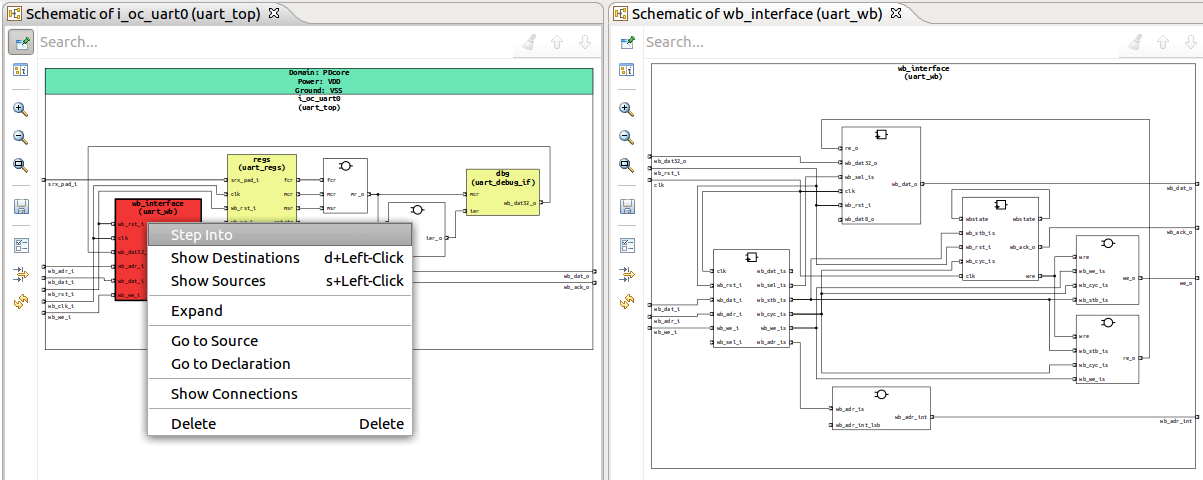
|
Step out |
Flow
Schematic
|
Instance |
Show the diagram one level above the current diagram top (if available). 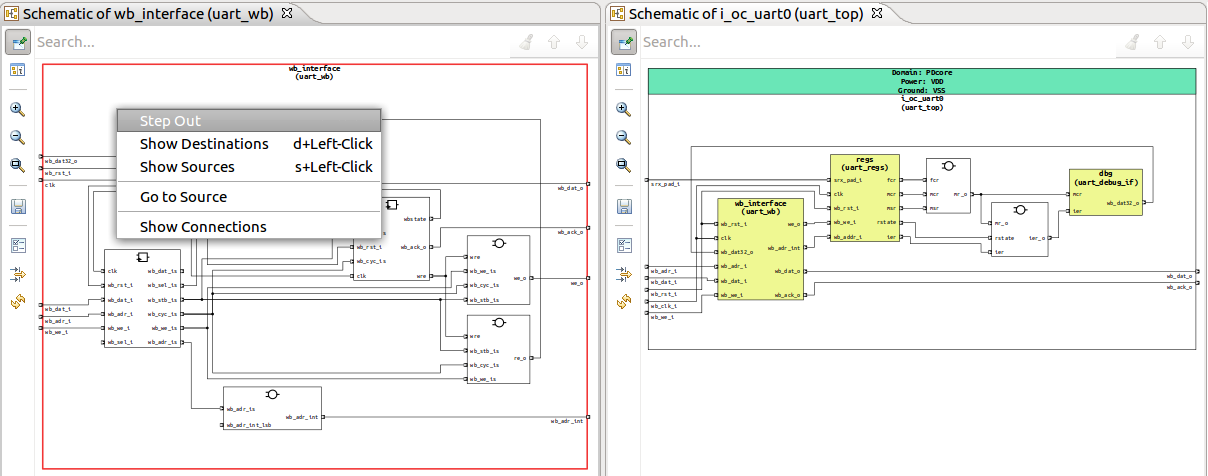
|
Expand |
Schematic |
Instance |
Show the sub-instances of the selected instance, while keeping the initial diagram. 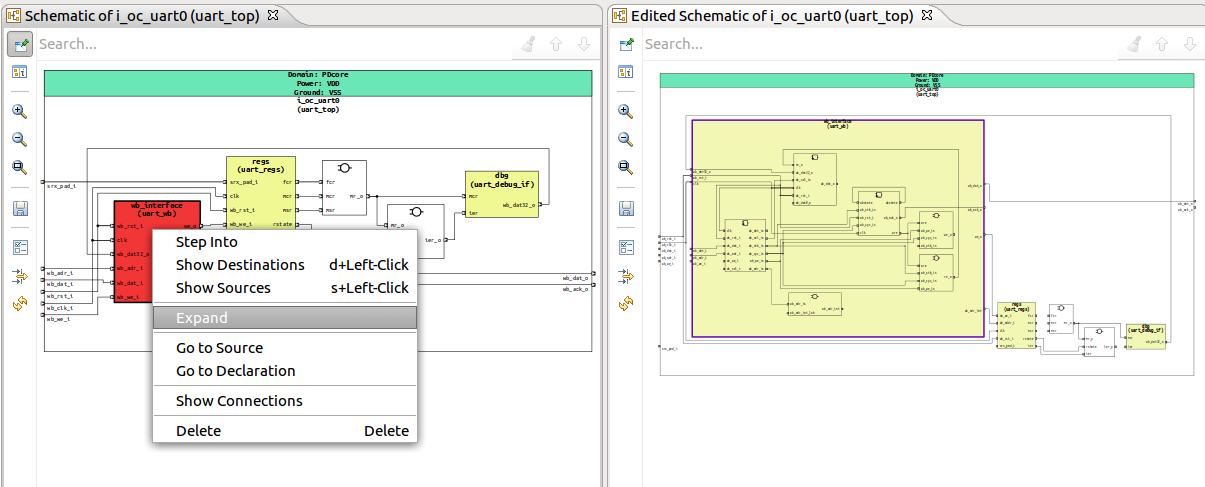
|
Collapse |
Schematic |
Instance |
Hide all the sub-instances and signals from within the selected instance. 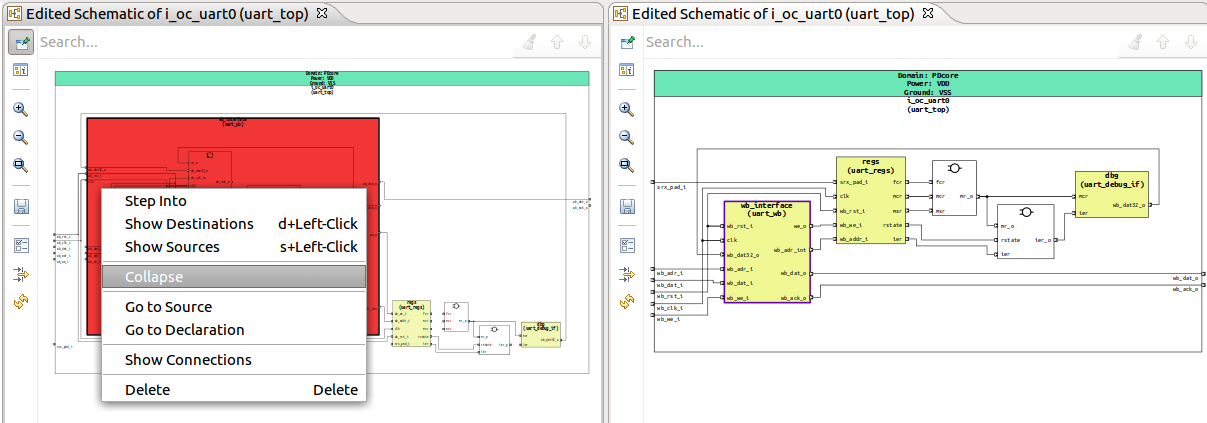
|
Show Sources |
Schematic |
Instance Logic Gate Port |
Show the instances that drive the selected port. 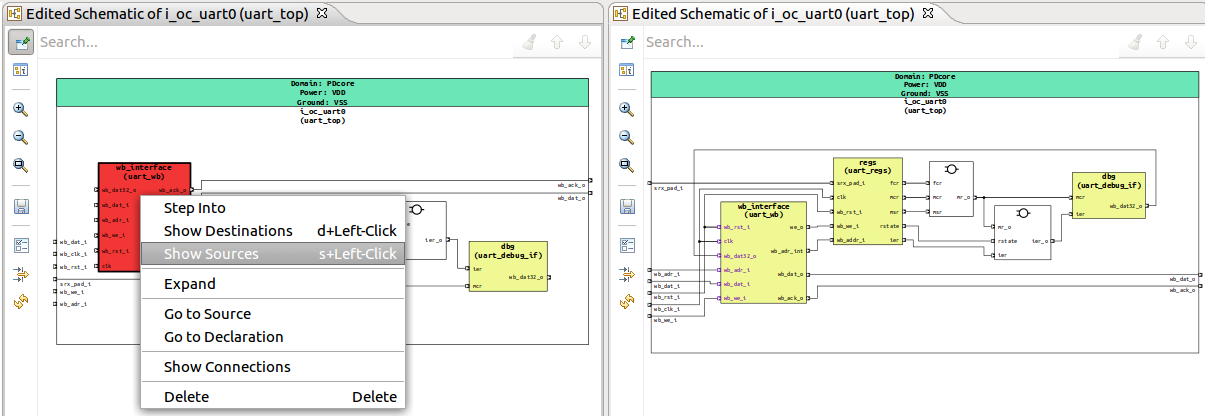
Note You can press S+Left-Click to trigger this action. |
Show Destinations |
Schematic |
Instance Logic Gate Port |
Show the instances that load from the selected port. 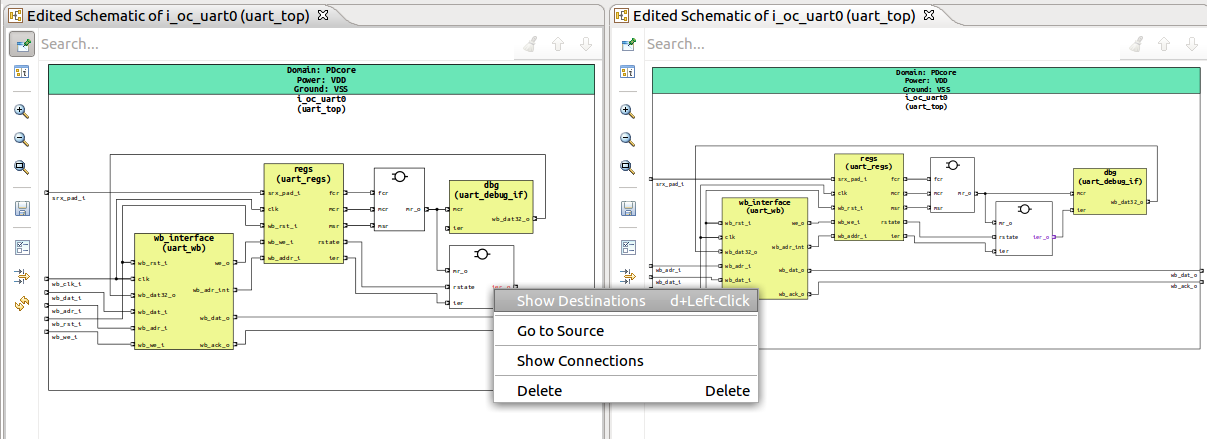
Note You can press D+Left-Click to trigger this action. |
Delete |
Flow
Schematic
|
Instance Logic Gate Connection Port |
Delete the selected element. 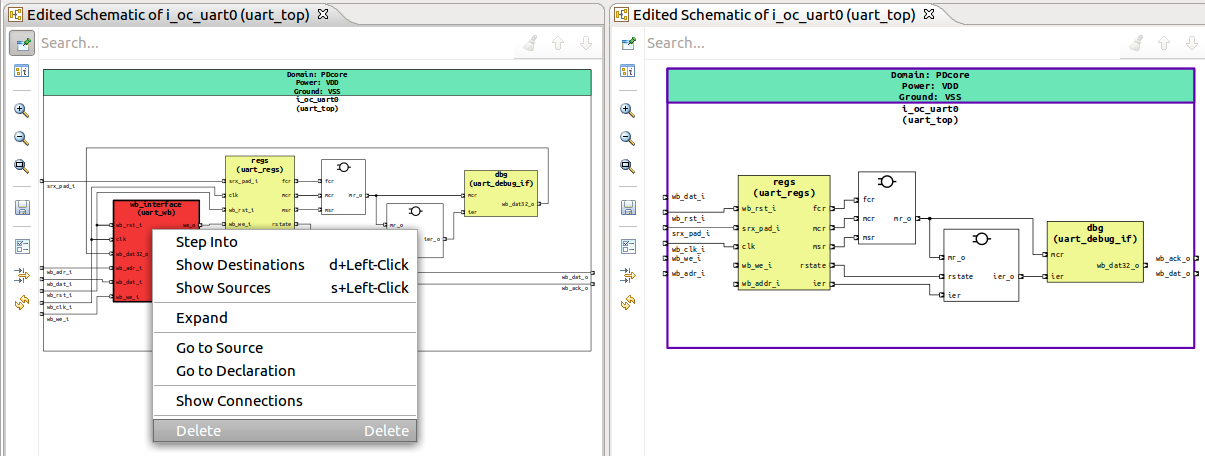
Note You can press DEL to trigger this action. |
Show Connections |
Flow
Schematic
|
Instance Logic Gate Connection Port |
Show all connections of the selected instances with other instances; when triggering this operation on a signal, the diagram shows that signal and all the instances it connects; when triggering this operation on a port, the diagram shows that port and all the instances connected through it. 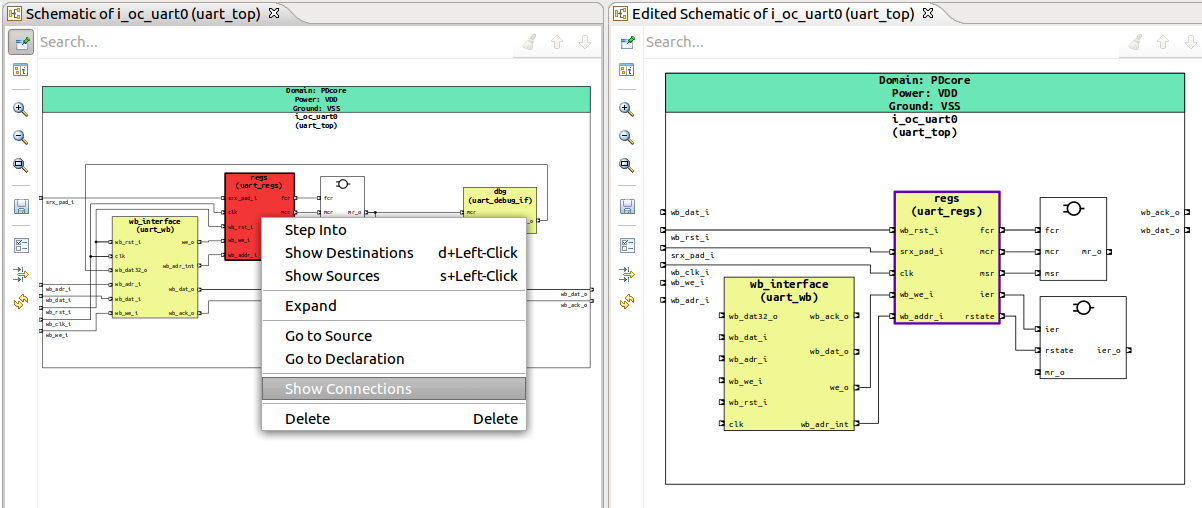
Note You can press C+Left+Click to trigger this action. |
Show Connections Between |
Flow
Schematic
|
Instance |
Show all connections between the selected instances, passing through logic. 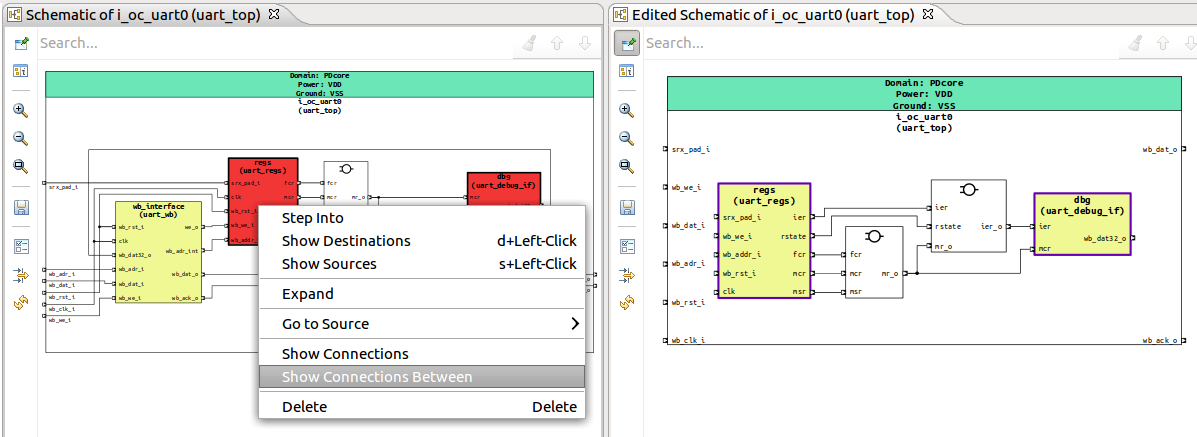
|
Trace Drive/Load/Drive and Load |
Schematic |
Connection |
Start a trace operation for the currently selected signal (see Trace Connections). |
Show in Supply Network Diagram |
Block
Flow
Schematic
|
Instance |
Generates the Supply Network Diagram, with focus on the current selected Power Domain Supply Network Diagram. |
Note
When performing an action on an instance, signal or port, a purple highlight contour is added to it.
Low Power Format Support
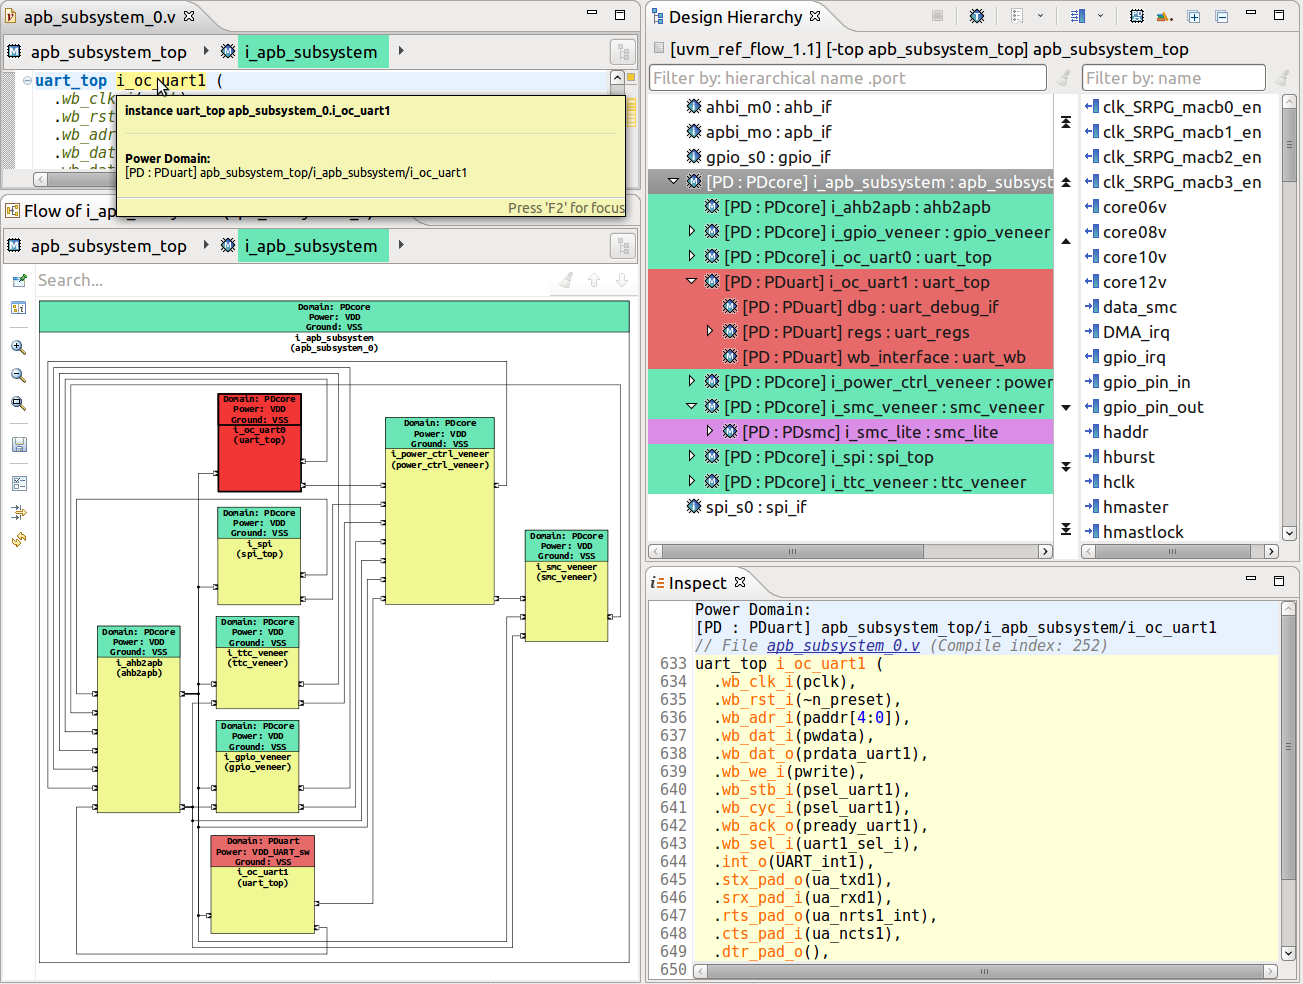
DVT analyzes power format files (either UPF or CPF) and presents power domain information in:
Design Hierarchy View - using labels and/or colors
Schematic Diagrams, Flow Diagrams and Block Diagrams - using labels and/or colors
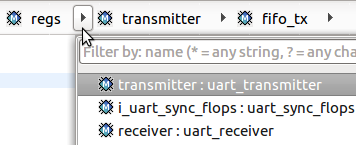
Breadcrumb Navigation Bar - using colors and tooltips
Tooltips in the Verilog and VHDL Editors
Power format project nature
In order to work with power format files, you have to enable the Power Format nature for your project.
In the New DVT Project Wizard check UPF/CPF
For an existing project, right-click on it in the Project Explorer View, choose Change DVT Nature then check UPF/CPF
The Power Format nature works only in conjunction with at least one of Verilog or VHDL natures.
Power format files
Use one of the following build configuration directives to specify a power format file to be analyzed:
Compatibility mode |
Directive |
|---|---|
ANY |
+dvt_upf+<upf_file> +dvt_cpf+<cpf_file> |
ius.irun |
-lps_1801 <upf_file> -lps_cpf <cpf_file> |
vcs.vloganvcs.vhdlgan |
-upf <upf_file> |
questa.vlogquesta.vcom |
-pa_upf <upf_file> |
Power format analysis
At full build, after elaborating the design, DVT analyzes (interprets) the provided power format file and elaborates the power domains. TCL and power domain errors are detected and reported during this phase.
All analyzed power format files are decorated with a blue bullet. Files outside the project directory are automatically linked under the DVT Auto-Linked folder.
Note
By default, the working directory of the TCL interpreter is the DVT project directory. To change it, use +dvt_compilation_root within the invocation where the power format file is specified, for example:
+dvt_init
+dvt_compilation_root+/path/to/new/compilation/root
+dvt_upf /path/to/file.upf
Note
Environment variables defined using +dvt_setenv within the invocation where the power format file is specified are available in the TCL $::env array.
Tip
To print power format analysis debug information in the DVT Build Console add this directive to your build configuration file:
+dvt_pf_debug
Tip
If a file called dvt_pre_interpret.tcl exists in any of the the User and Common Settings Location it will be interpreted before the provided power format file. If several such files exist, they will all be interpreted, in precedence order of the User and Common Settings Locations. This mechanism allows you to define TCL variables or functions for debugging or deployment purposes.
Incremental power format analysis
Whenever you change a power format file which was analyzed during the full build phase, DVT triggers a power format file analysis and a power domain elaboration.
Whenever you change a design file (Verilog or VHDL) which was compiled during the full build phase, DVT triggers a power domain elaboration (analysis of power format files is not performed).
The following Common Power Format (CPF) and Unified Power Format (UPF) commands are supported by DVT:
CPF up to Version 2.1
create_power_domain -name <power_domain_name> -default
-instances <instance_list> -exclude_instances <instance_list>
set_hierarchy_separator <separator_character>
set_instance <instance>
include <cpf_file>
UPF (IEEE Std 1801™) up to Version 3.0
create_power_domain <power_domain_name>
-elements <instance_list> -exclude_elements <instance_list>
-include_scope -scope <scope>
upf_version <version>
set_scope <scope>
load_upf <upf_file> -scope <scope> -version <version>
Supply Network Diagram
The Supply Network Diagram shows all the power domains and power switches, and how they are connected via supply nets and ports.
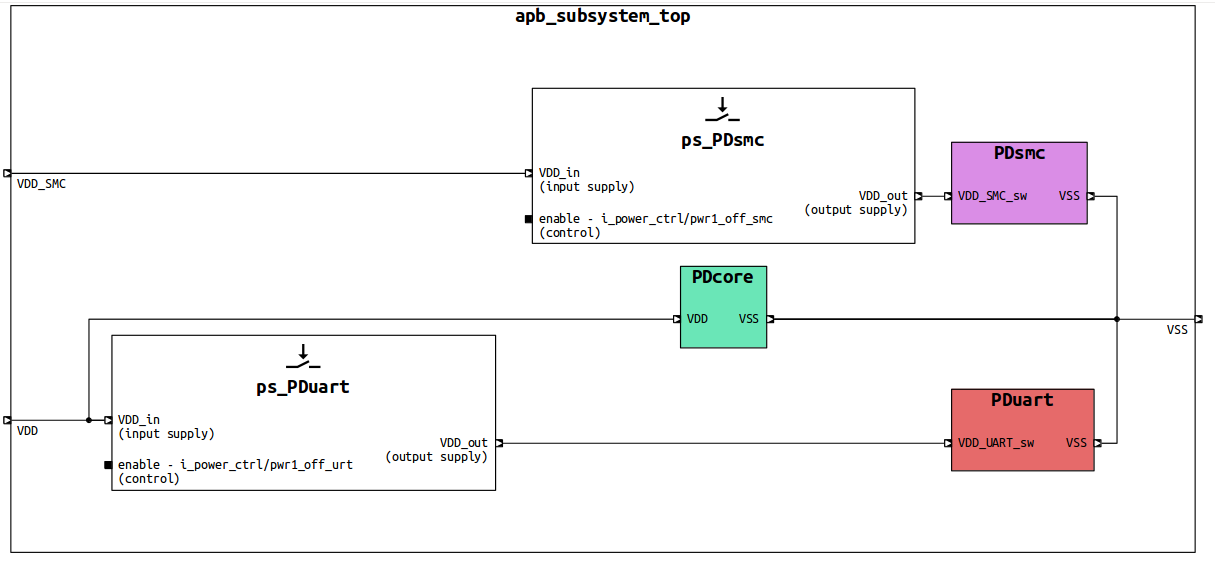
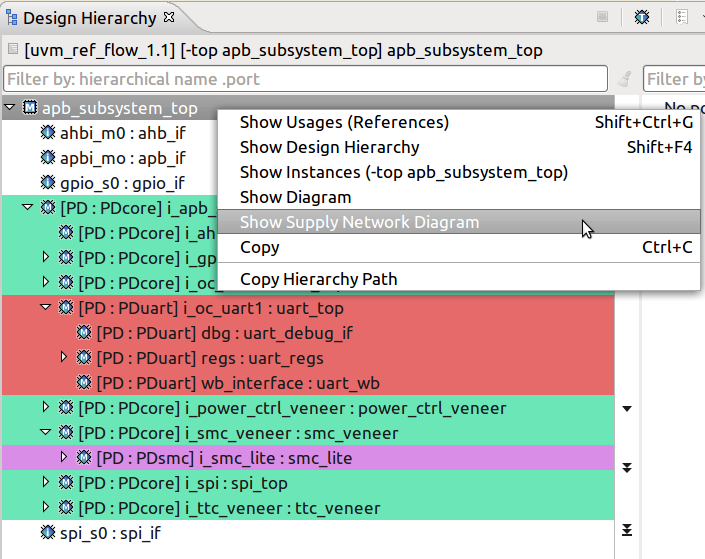
To generate the Supply Network Diagram:
Click the Generate Diagram toolbar button and choose Supply Network Diagram

Right-click on the top instance of your design in the Design Hierarchy View and choose Show Supply Network Diagram
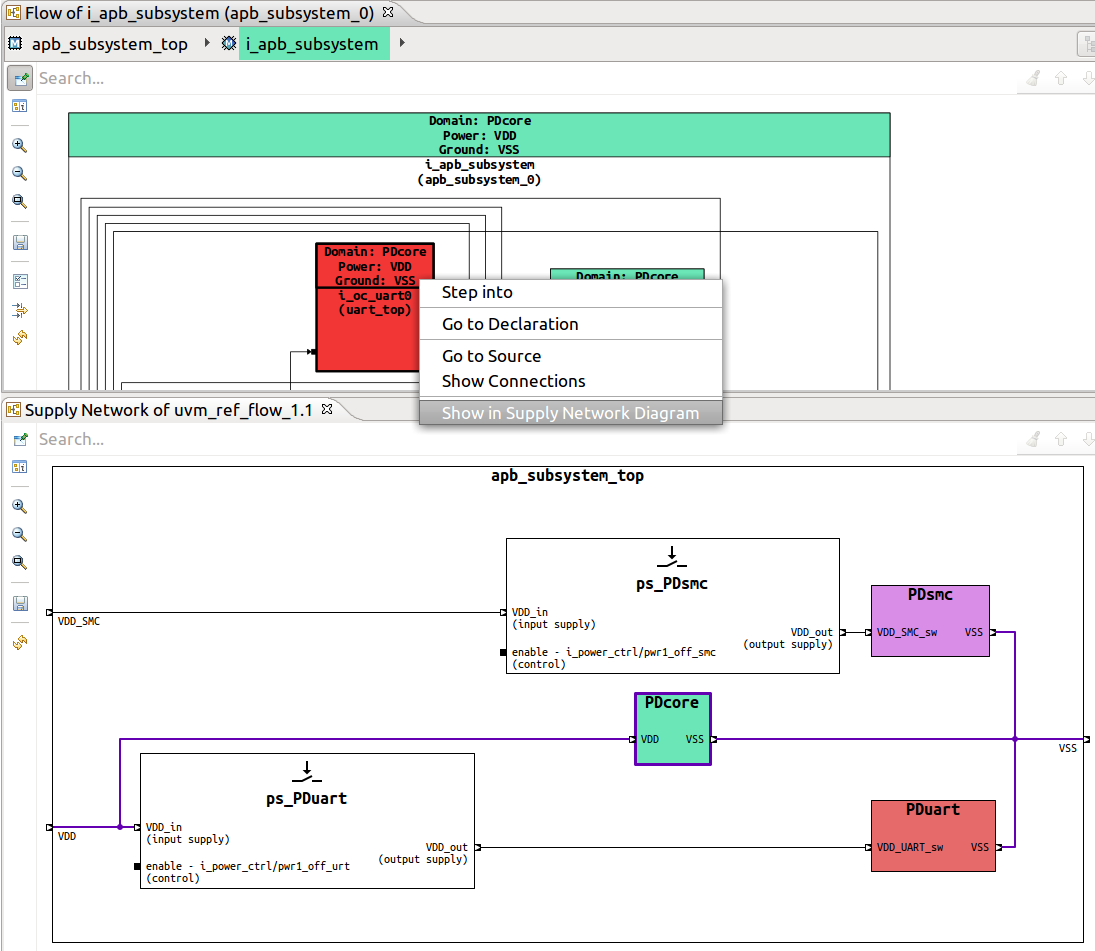
Tip
To visualize a power domain and all its connections, from the Schematic Diagrams, Flow Diagrams and Block Diagrams right click on an instance included in the extent of the power domain and choose Show in Supply Network Diagram.
Tip
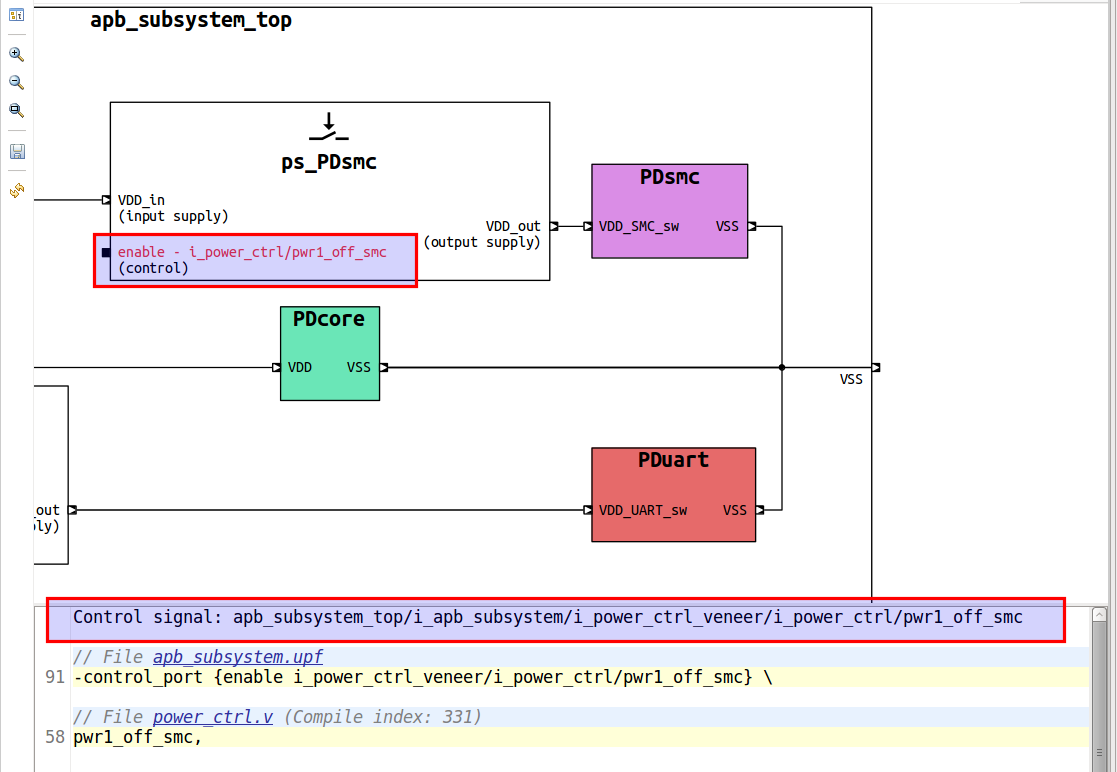
To quickly jump from the Supply Network Diagram the control signal of a power switch, select the control port, right click and choose Go to Source.
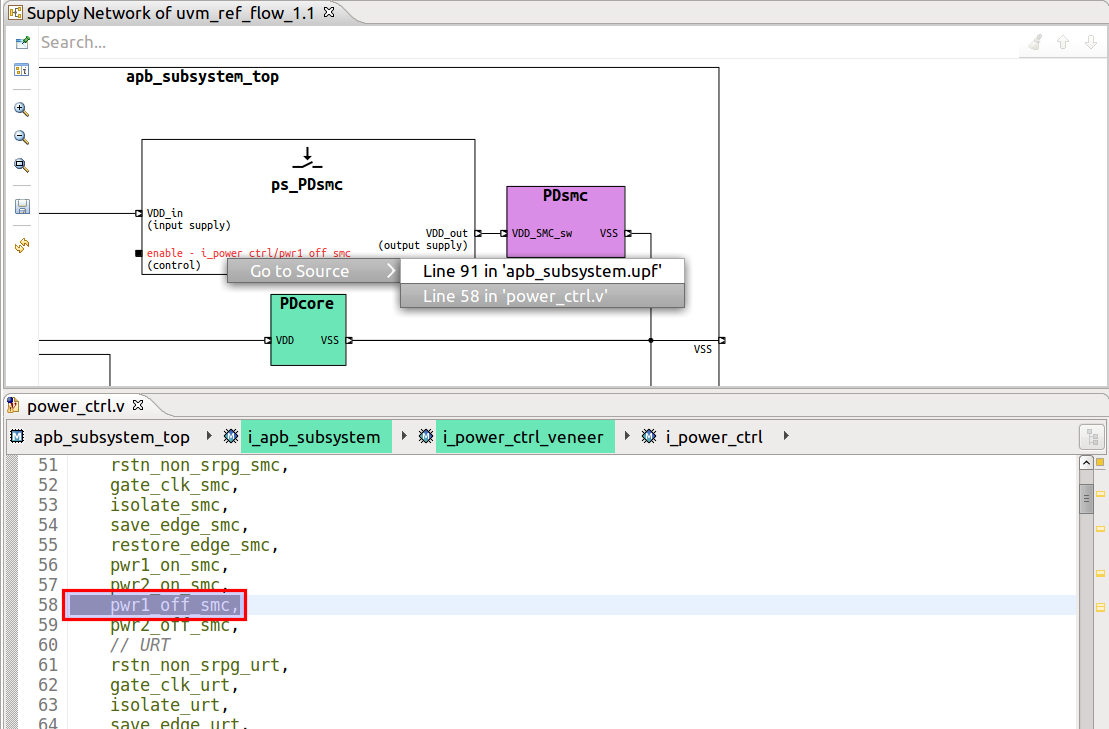
Note
For readability, the path to control signals is shortened in the diagram labels. Select the control port to see its full path in the Inspect View.
