Basic Tutorial
This tutorial provides a step by step walk-through of the VHDL development environment.
Switch to the DVT Perspective
The VHDL Perspective provides a workbench layout with many useful views and shortcuts at hand for developing VHDL code, for example the entity and architectures browser.
From menu choose DVT.
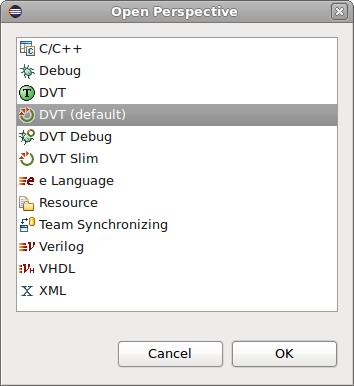
You can customize and save a perspective. In order to further speed-up the development, at any time you can switch between various perspectives with different tool (views) layouts. For example you can use one perspective for writing code (the editor will take most of the real estate) and another perspective for code navigation (type browser will be a significant component).
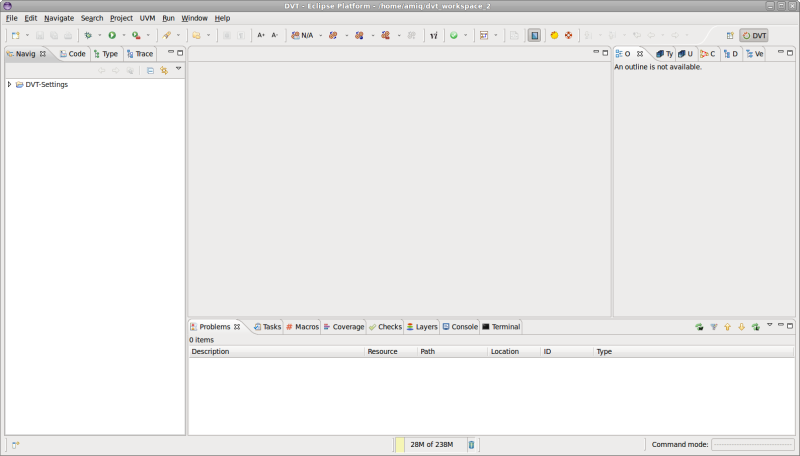
The default DVT perspective looks like this:
Open a Project
A project corresponds to a specific directory on the disk. The project is presented in the Navigator View - a file browser component that helps you browse the project directory contents.
See also
Create a New Project
Invoke the New Project Wizard: choose menu .
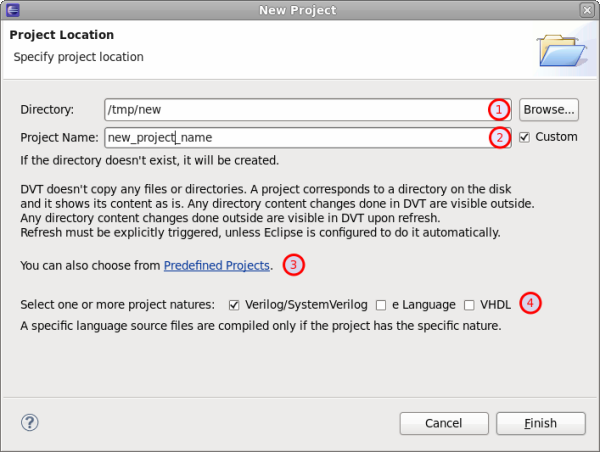
Specify the Project Directory It can be a directory that already contains sources or a new directory that will be created.
Specify the Project Name By default, the project’s name is the last segment of the project’s directory path (e.g. /tmp/path1/path2/p_name > p_name). You can change this name by selecting Custom.
Note
If Project Directory points to an existing project, you cannot change its name.
Open a Predefined Project You may open one of the predefined projects that DVT ships with and continue to explore the DVT features. For more details see Predefined Projects.
Specify the Project Nature. If the poject does not exist or it does not contain any nature, you must select at least one nature. This way DVT will compile the respective sources.
Configure the Build
In order to provide advanced functionality (like hyperlinks, autocomplete, design and class hierarchy, error signaling, etc.) DVT analyzes the source code files in your project. This analysis process is called build.
In order to build, DVT uses the arguments that you specify in one of the <name>.build files located in the .dvt folder of your project.
The default build configuration is .dvt/default.build. Here you list compilation directives in a similar way you would pass arguments to any simulator.
When a project is created using the New DVT Project Wizard, the default build configuration file contains the +dvt_init_auto directive, that triggers the DVT auto-config mechanism. For more details, see Auto-config.
The DVT auto-configuration algorithm automatically detects and analyses existing Intel(Altera) Quartus or Xilinx ISE/Vivado projects in the project root directory to generate a build configuration. For more details, see FPGA Support.
If no source code files are found for compilation, you’ll be notified there is nothing to build.

To configure the build follow the link in the build notification dialog or open the .dvt/default.build file.
See also
Build the Project
Once you specified the files you want to compile, the incdirs to be used for `include and so on, you should rebuild the project. In general, every time you change the .build configuration, you should rebuild.
In order to rebuild you click the Rebuild button  .
.
While editing source files, a project is incrementally compiled as soon as you save, unless the menu option is un-checked.
The building progress is reported in the Progress View. Depending on your configuration, you may also see detailed information in the Console View.

Inspect the Compilation Errors
Syntax errors are detected as you type.

They are indicated in the vertical bars of the editor (right - for the visible code, left - for the full file). If you keep the mouse over the marker on the left you’ll see more details about the error.

Same tooltip will appear if you keep the mouse over the marker on the editor right bar. You can also click on the marker to jump to the error.

If a project contains errors, for example syntax errors, it will be indicated using decorators:
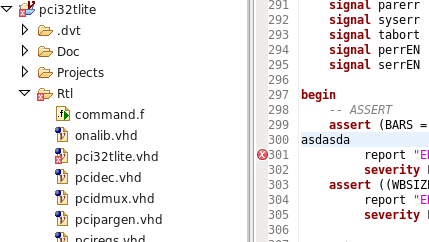
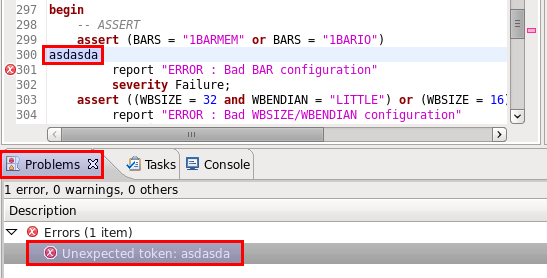
You can use the Problems View to inspect the errors. You can show the Problems View from menu . Double clicking on some error will jump to the source location.
See Comments in Tooltips
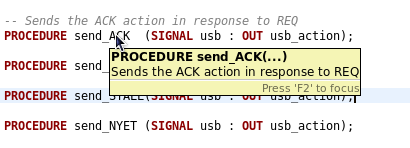
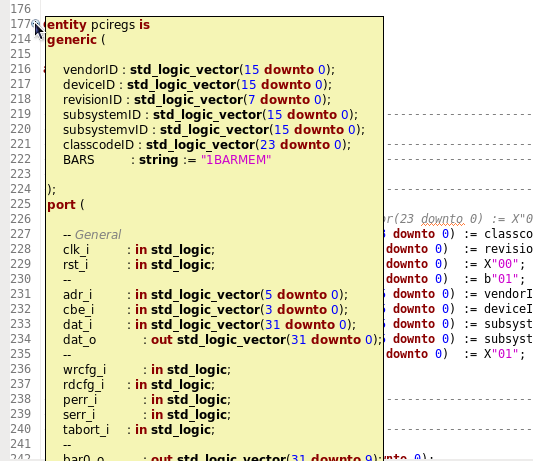
When you position the mouse over a type, method, field etc., a tooltip will pop-up showing information on corresponding declaration.
Some examples are presented below. In a similar way you’ll see information on fields, events, variables etc., predefined or not.
Type Info |

|
Function Info |

|
Procedure Info |
|
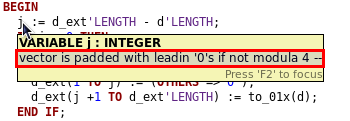
The information presented in the tooltip is created using the comment on top of the declaration.
For example, given the following declaration of a field:

the corresponding tooltip will look like this:
Use Hyperlinks to Move Around in the Code
If you place the mouse over a type, method, field etc. and press the Ctrl key, a hyperlink will be presented. Click on the hyperlink to jump to definition.
You can also jump to a definition if you put the cursor on the relevant name and press F3.

Quickly Open a Type (Entity, Architecture)
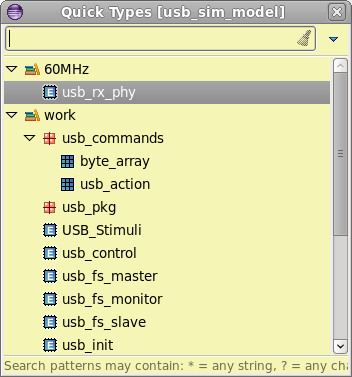
You can quickly open a specific type definition. Press Ctrl+Shift+T.
The Quick Types View will pop-up and you can enter any regular expression to locate a type. Select and press Enter or Click to jump to its definition.
Quickly Open a File
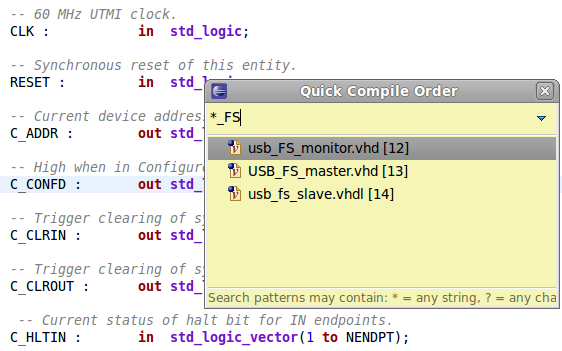
You can quickly open a compiled file. Just press Ctrl+I. The Quick Compile Order View will pop-up and you can enter any regular expression to locate a file. Select and press Enter or Click to open the file.
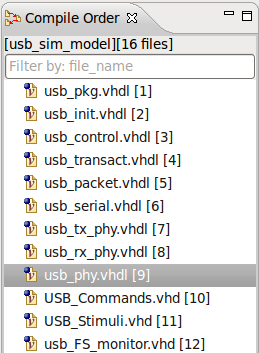
You can also see the include tree of the files in your project in the Compile Order View. Open the view from menu .
Quickly Move Inside the Editor
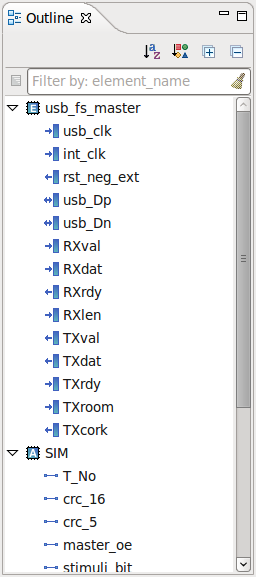
Press Ctrl+O to open the Quick Outline for an overview of your file. You can enter any regular expression to locate an entity to jump to the current file.
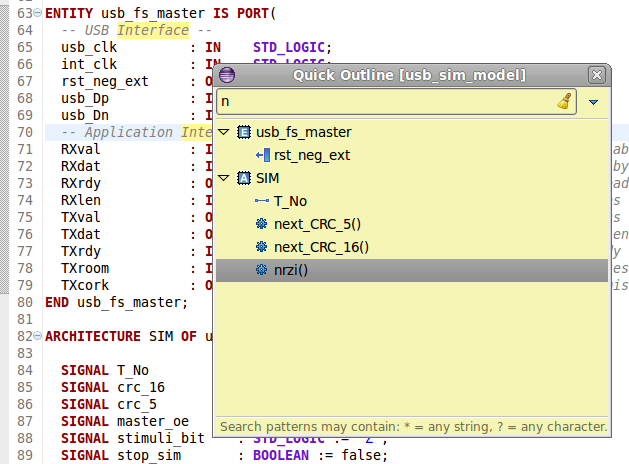
You can also see the outline in the Outline View. Open the view from menu .
Inspect the Design Hierarchy
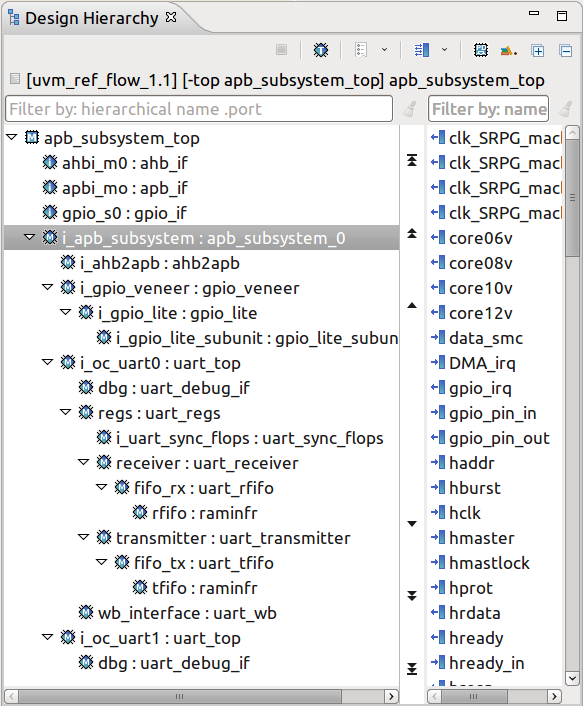
Position the cursor on a entity or architecture name and press Shift+F4 or right click and choose from the menu.
The Design Hierarchy View opens with the chosen element set as the top of the hierarchy.
Browse Through All the Available Types (Entities, Architectures)
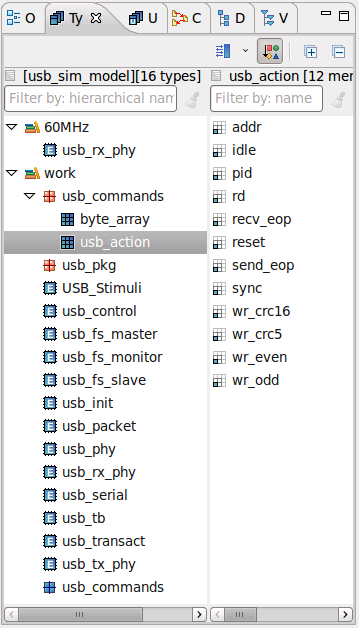
You can explore all the types like entities or architectures that are defined in your project using the Types View.
Go to menu to open the Types View.
Search for Entities
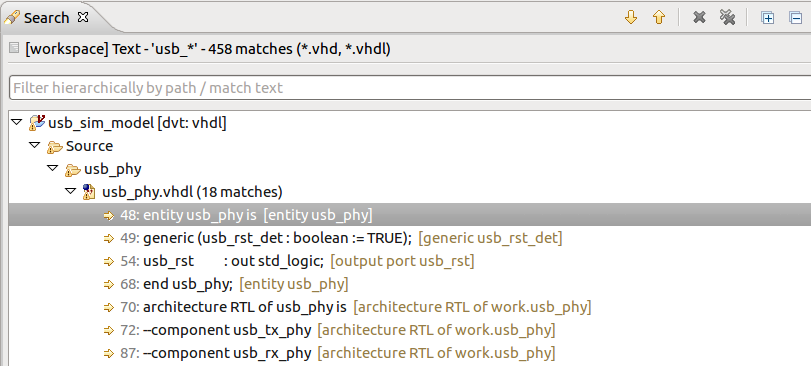
You can search for a specific type, method etc. in the current project or whole workspace. Press Ctrl+H to pop-up the search dialog.
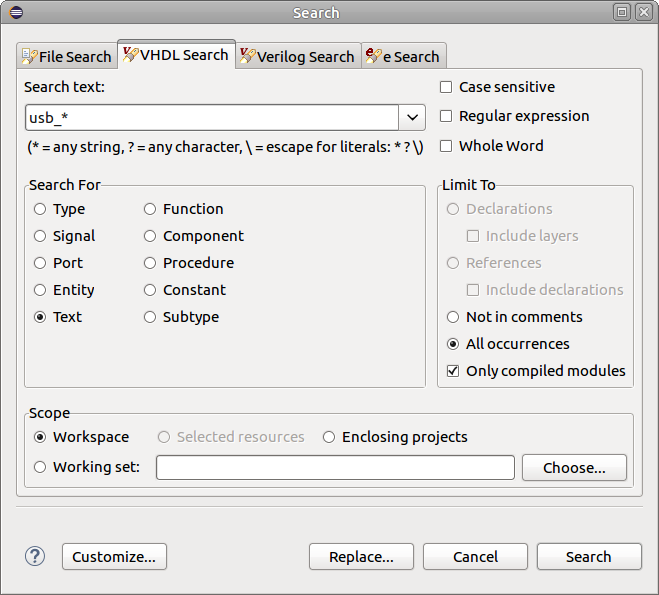
The results are presented in the Search View.
Use Content Assist (Autocomplete)
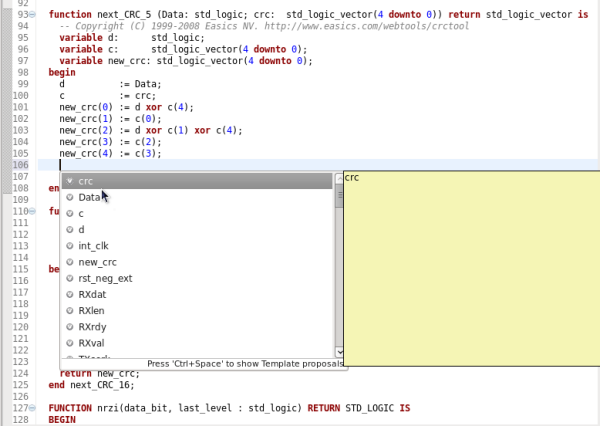
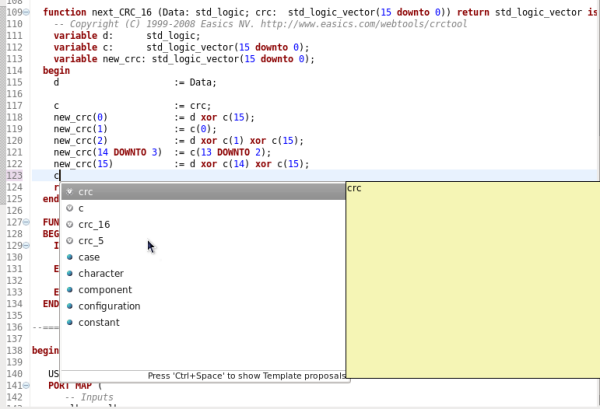
Content assist provides you with a list of suggested completions for partially entered text. Proposals are context dependent and include accessible entities, architectures, configurations, variables, signals, constants,functions, procedures, etc. as well as templates for various constructs.
Press Ctrl+Space to trigger content assist.
Content assist is triggered automatically in some contexts, for example when you type in a <=, or := in the editor.
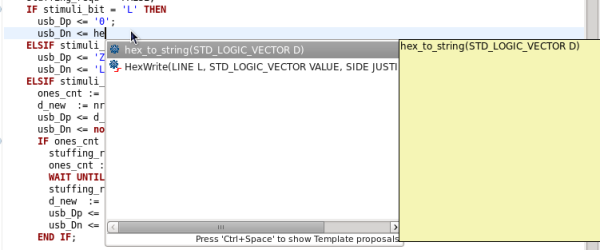
Proposals are presented in a list for you to chose from. Moving through proposals you can quickly see the related documentation.
Press Enter or Click to select a proposal or Esc to cancel the assist.
Use Code Templates
When you trigger autocomplete using Ctrl+Space, template suggestions may appear in the proposal list.

To define templates go to the preference page (via menu ) and select VHDL from Select Nature:.
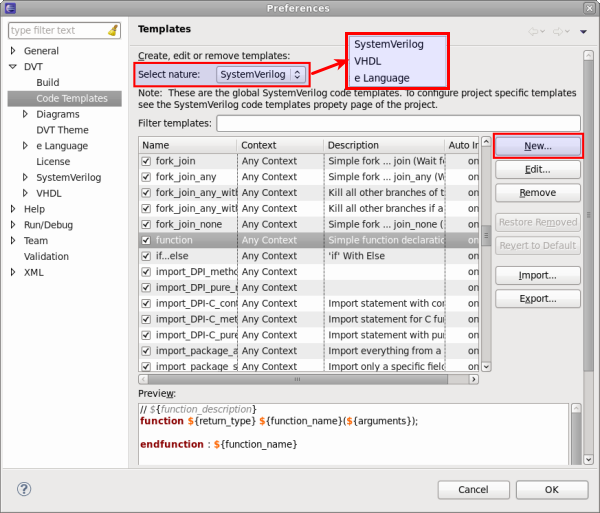
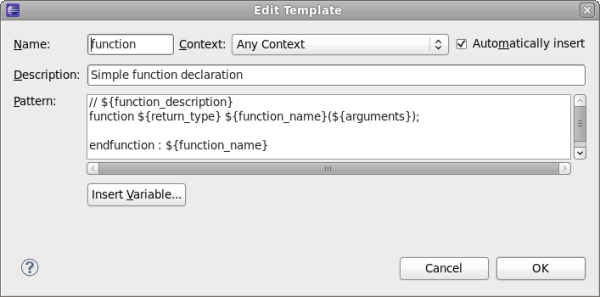
Click the New button to define a new template. The template name is important for proposal filtering based on already typed text.
Use Component Auto Instance
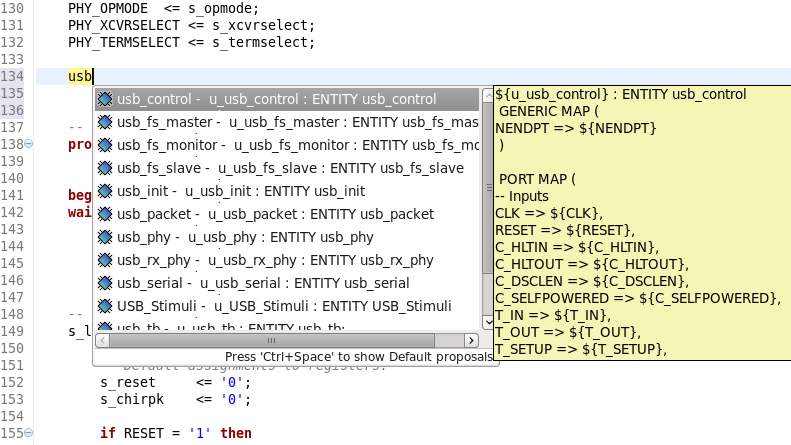
You need to type the first letters of the component(entity, configuration, component) name, then press Ctrl+Space three (3) times. You can recognize component instances by their icon, it looks like a chip with ports ready to be glued in.
You can customize what gets generated from menu in the Auto-instantiation section.
Track Tasks using TODO Markers
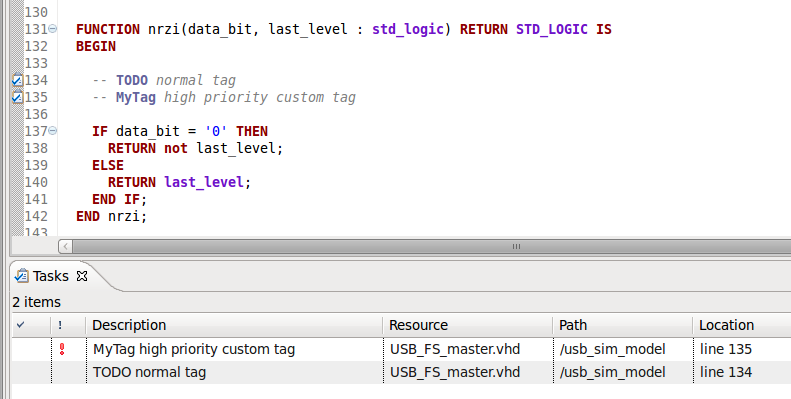
If you place TODO markers in your code they are recognized and presented in the Tasks View. This is a mean to insert reminders, preserve, track and share them with your team.
You can use TODO markers inside comments. FIXME (high priority), TODO and XXX (low priority) are recognized.
Go to menu to open the Tasks View.
Double click on a task to jump to the marker definition.
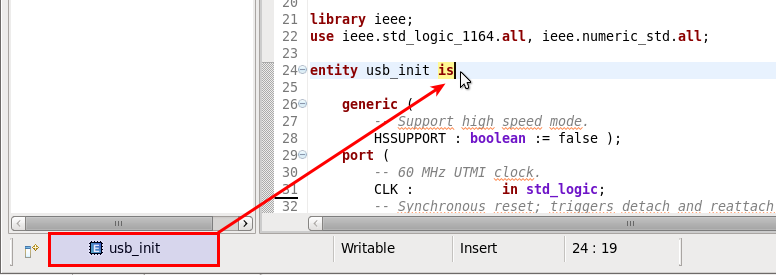
Quickly See the Current Scope in the Status Bar
The scope at cursor (procedure, architecture …) is always presented in the status bar.
Fold Code Regions in Order to Improve Readability
Use the Expand All  button or the Collapse All
  button from the toolbar or from right click menu to unfold/fold the current file.
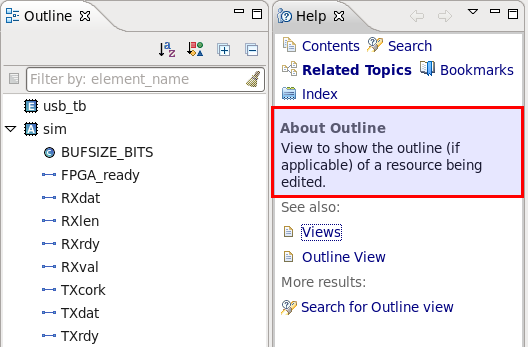
Access the Context Sensitive Help
A focused set of help topics that is related to the current context can be shown to users on demand using context-sensitive help. This form of user assistance is delivered to users when a platform-specific trigger is activated (e.g. F1 key on Windows, Ctrl+F1 on GTK, Help key on Carbon):
