Tooltips
A tooltip is a brief, informative message that appears when a user interacts with an element in a graphical user interface (GUI). In DVT tooltips are initiated through a mouse-hover gesture.
The below table highlights all the available areas from where tooltips can be triggered:
Code |
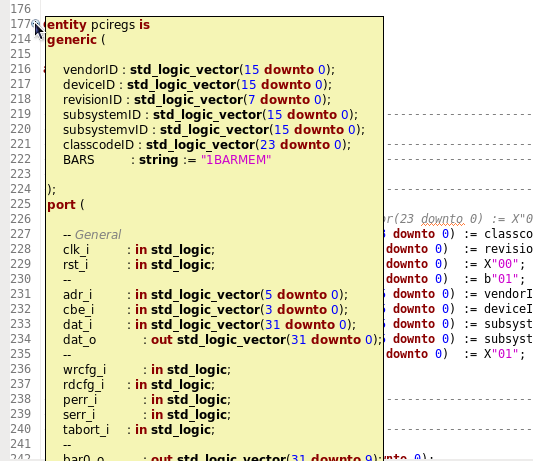
Place the mouse cursor over an identifier in the editor. A tooltip shows information about the element under cursor:

Tooltips are available for all the entities, architectures, subprograms, etc. from the source code files that DVT analyzes in your project. |
Folded regions |
Place the mouse cursor over the + sign of a folded code region. A tooltip shows the folded region contents. 
|
Generic Values |

|
Problems |
Place the mouse cursor over an error or warning annotation on the left vertical ruler of the editor. A tooltip shows the error or warning message. 
If multiple problems are reported on the same line, an annotation list is displayed. |
Subprogram Call Parameters Mapping
Ordered Generic Mapping
Ordered Port Connection Mapping
|
Place the editor cursor on a subprogram call argument and press Ctrl+Shift+Space. A tooltip lists all the subprogram declaration arguments along with their name, type, direction and default value. Move the editor cursor using the arrow keys to inspect argument mapping - the argument under cursor is always highlighted in boldface. 
The same functionality is available for instance generic connections and instance port connections. 

|
WaveDrom Diagrams |
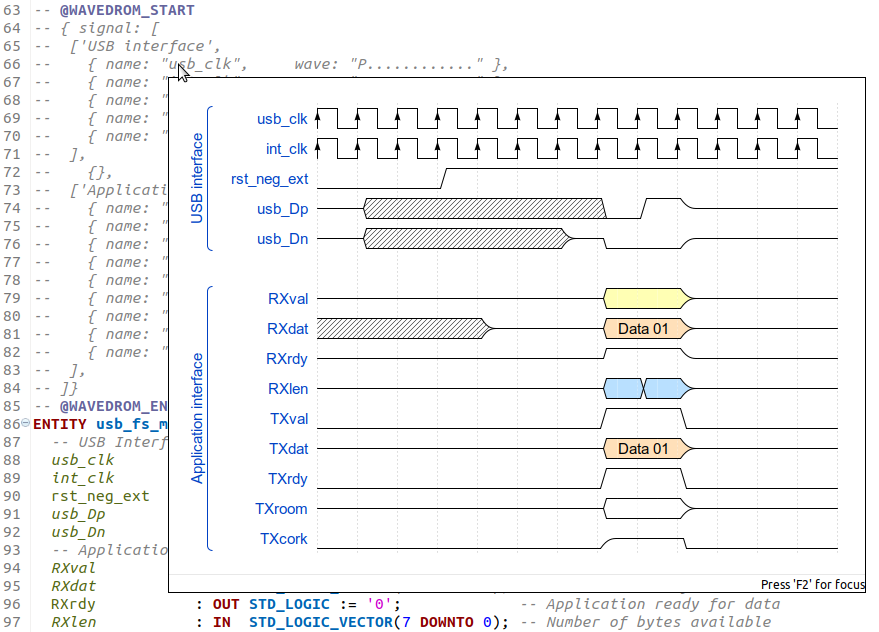
Place the mouse cursor over a JSON waveform description written inside a comment. The tooltip will display WaveDrom Timing Diagrams, if the descriptions are compliant with the WaveDrom library standard: 
|