Views
Code Templates View
The Code Templates is located near the Navigator and Hierarchy views or you can open it from .
To insert a template in a code editor, you can either:
drag and drop it in the editor at a specific location
double click on it
click on Insert into editor button
right-click on it > Insert
Note
If you choose one of the last three actions mentioned above, the template will be inserted in the current editor at the current cursor’s positon. Please make sure you have an opened editor and the cursor is at the right position before adding the template!
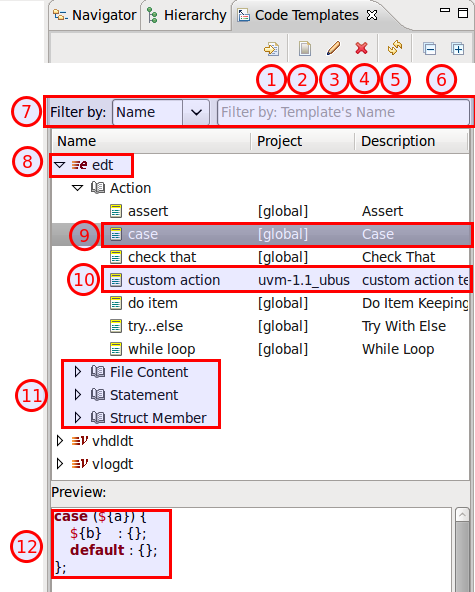
Insert the selected template into the current editor
Create a new template
Edit the selected template
Remove the selected template (NOTE: you cannot undo this operation!)
Refresh the view (if it doesn’t automatically update when you modify templates/projects etc.)
Collapse/expand all
Filter templates (you can filter them by: nature, context, name, project, description)
Templates’ natures
Templates’ contexts
Preview the template’s pattern (it automatically updates when clicking on a template)
To create a new template, click on Create a New Template button on the toolbar:
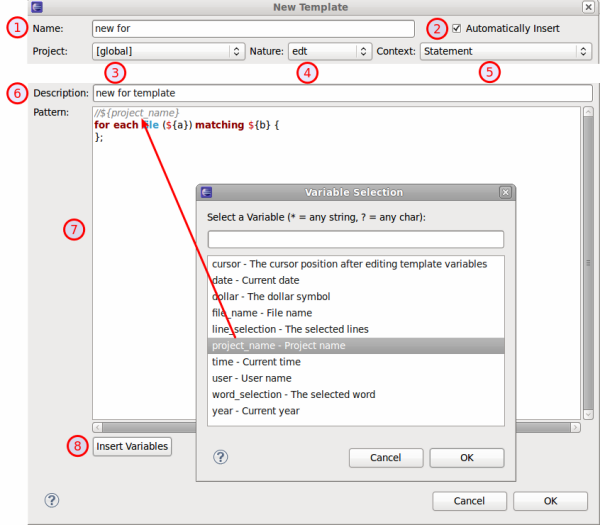
Template’s name
Check Automatically insert if you want the template to expand automatically on Ctrl+Space when there is no other matching template available. It is usually good idea to leave the checkbox checked, otherwise you would get a template proposal “popup”
Each template must be created under a project available in the current workspace (select [ global ] for a global template)
Assign a nature - only natures relevant to the selected project will be displayed
Template’s context - only contexts relevant to the selected nature will be displayed
Templates’s description
Code Pattern - embed variables in ${} e.g. ${variable_name} to enable the template proposal wizard when inserting the template into an editor
Insert variables - here you can find some useful misc. predefined variables
Compile Order View
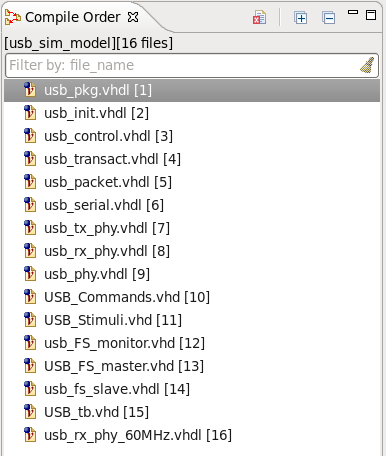
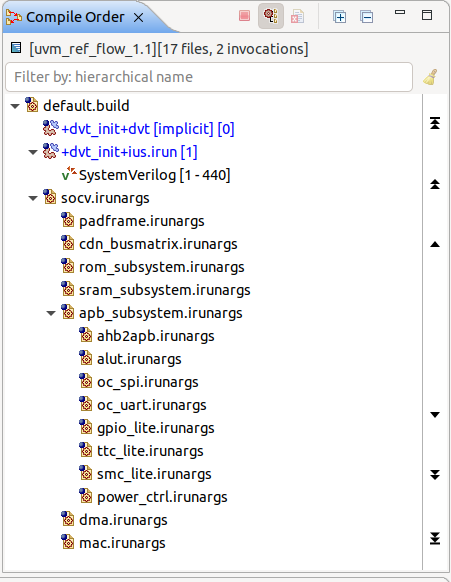
The Compile Order View presents the hierarchy of compiled files as it results from the `include compiler directives, starting from the project top files.
Open the view from menu Window > Show View > Other… > DVT > Compile Order.
Double click on a file to open it.
You can use CamelCase or Simple Regex to locate a specific element.

|
A file that is not part of the current project (files are not under the project directory). |
|---|---|

|
A file in your project. |
Build Config Hierarchy
Press Show Build Config button to open the build config hierarchy as it results from the ‘-f’ compile directives, starting from the active build configuration.

Note: Each invocation section will be added under the coresponding build configuration file.
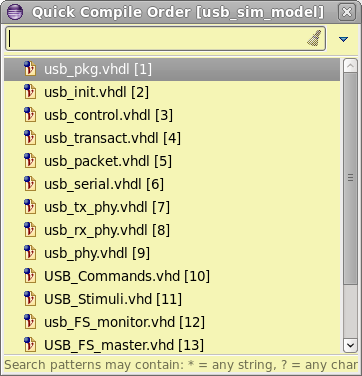
Quick Compile Order View
Press Ctrl+I to quickly open a compiled file.
The Quick Compile Order View will pop-up and and present a filterable list of all the compiled files in the project.
You can use CamelCase or Simple Regex to locate a specific element.
Select a file and press Enter or click to open it.
Console View
Any invocation (for example a DVT Generic run) output is dumped to the Console View.
The Console View is automatically raised at any invocation.You can also go to menu Window > Show View > Other… > General > Console. to open the Console View.
Click on hyperlinks in the Console View to jump directly to the to source location.

Design Hierarchy View
The Design Hierarchy View presents recursively the instances in a Verilog module or the instances in a VHDL entity or component implementation. Cross-language design hierarchies are also supported.
Position the editor cursor on the name of a design element and press Shift+F4 or right-click and choose from the context menu.
The Design Hierarchy View opens with the chosen element set as the top of the hierarchy. You can also go to menu to open the view.
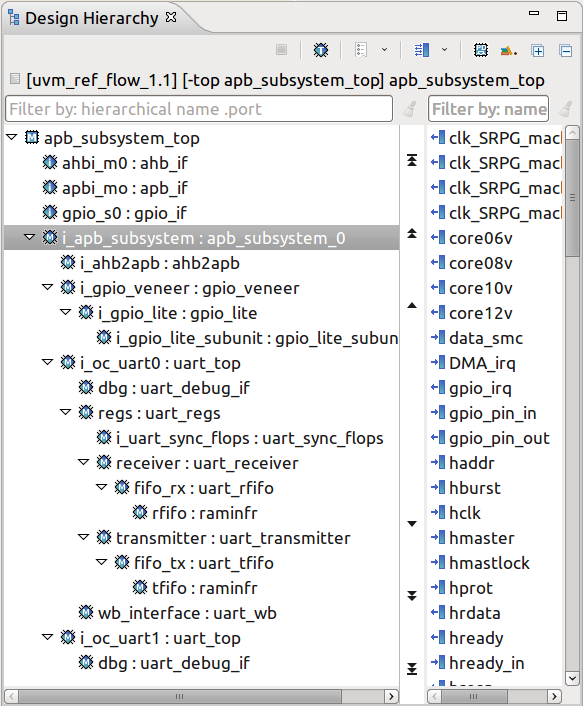
 Cancel Current Operation Stops the view operation in progress, for example a search.
 Select Top A drop-down menu/pop-up dialog to select from top modules for Verilog or top architectures for VHDL. For Verilog, a top element is a module that instantiates other design elements and it is not itself instantiated. Similar for VHDL top architectures.
 History List Click to see the previously inspected elements.
 Show/Hide Ports Shows or hides the ports of the selected element. You can set the ports panel to the right or below the hierarchy.
 Show PD Shows or hides power domain information. You can choose to see the power domain names in the node labels, and distinctive foreground or background colors for all nodes belonging to the same power domain.
 Prepend Library Prepend to the node label the name of the library to which the instance belongs.
You can scroll through the tree of instances using:
the mouse scroll wheel
the Up arrow, Down arrow, PgUp, PgDn keys
- the vertical button bar on the right side of the tree
 go to top of tree
 up one page
 up one element
 down one element
 down one page
 go to bottom of tree
Note
The up/down buttons are grayed out when reaching the top/bottom of the tree.
You can double-click on an instance to go to its declaration. Double-click on a port to go to where it is connected.
Right-click on an instance in the hierarchy and you have the following options :
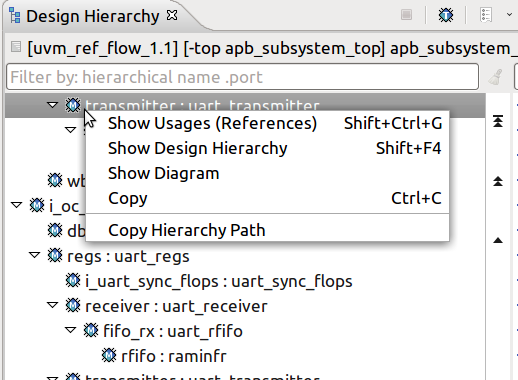
Show Usages (References) Search for the references of the selected instance. More details Show Usages, Readers or Writers
Show Design Hierarchy Show the design hierarchy starting from the selection.
Show Diagram Show the design diagram for the current selection. More details Design Diagrams
Copy Copy the label text of the selected instance to clipboard.
Copy Hierarchy Path Copy the hierarchy path of the selected instance to clipboard. You can change the segment separator from .
Right-click on a port and you have the following options :
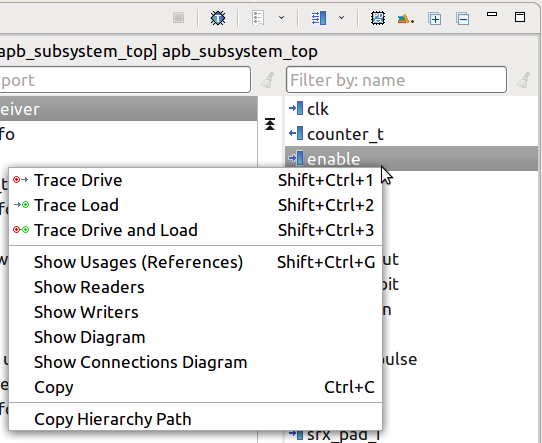
Trace Drive / Load / Drive and Load / In Subinstance See Trace Connections View.
Show Usages (References) Search for the references of the selected port. More details Show Usages, Readers or Writers
Readers / Writers See Show Usages, Readers or Writers
Show Diagram Show the Finite-State Machine for the current selection. More details Finite-State Machine Diagrams
Show Connections Diagram Show the Schematic Diagram of the selected port and all the instances connected to it
Copy Copy the label text of the selected port to clipboard.
Copy Hierarchy Path Copy the hierarchy path of the selected port to clipboard. You can change the segment separator from .
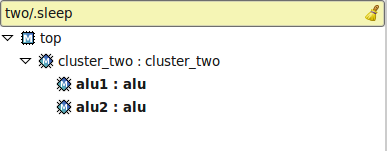
You can use the filters to locate a specific instance or port. You may use slash ‘/’ characters to filter hierarchically one level and ‘//’ to filter hierarchically all the levels. You may use the dot ‘.’ character to filter instances that contain a specific port. The ports that match the filter are promoted to the top of the ports panel. See Quick Search in Views for more details.
No filter. |
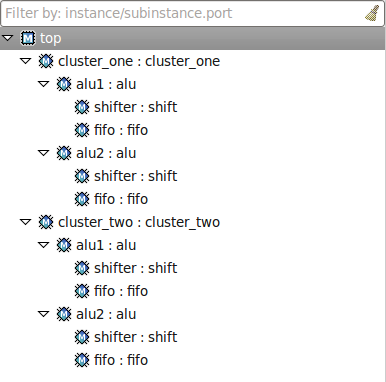
|
Filter by instance name. All instances that contain the filter text are shown. |
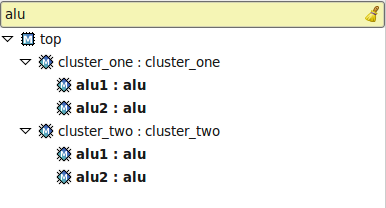
|
Filter strict hierarchy. All instances that contain the filter text and are in a direct hierarchical relationship (father/son) are shown. |
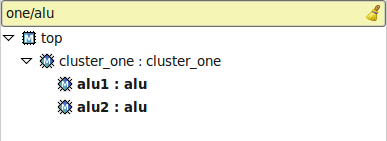
|
Filter non-strict hierarchy. All instances that contain the filter text and are in a direct or indirect hierarchical relationship (ancestor/../../descendant) are shown. |
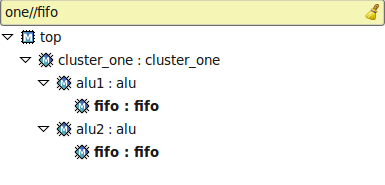
|
Filter strict hierarchy and show all descendants. Same results as for filter strict hierarchy, but including all descendants of the matched instances. |
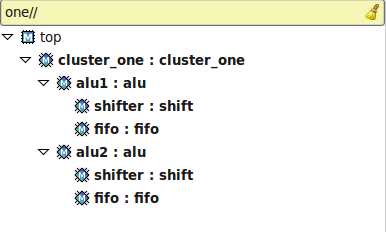
|
Filter strict hierarchy and show direct descendants. Same results as for filter strict hierarchy, but including the sons of the matched instances. |
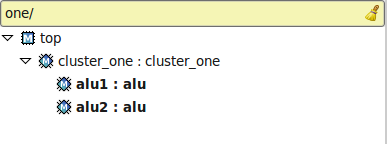
|
Filter by port name. All instances with ports that contain the filter text are shown. |
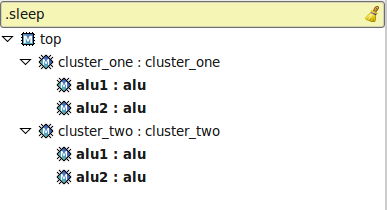
|
Filter by hierarchy and port name. Hierarchical filtering and port filtering may be combined. |
|
Note
To switch to the Old Design Hierarchy View (pre DVT 20.1.1) go to Window > Preferences > DVT and enable Switch to Old Design Hierarchy View
Inspect View
Inspect View shows detailed information about various elements in DVT.
Open the view from menu .
To inspect an element, simply select it in a view or click on its name in the editor.
Information about the selected element will be presented in the view.
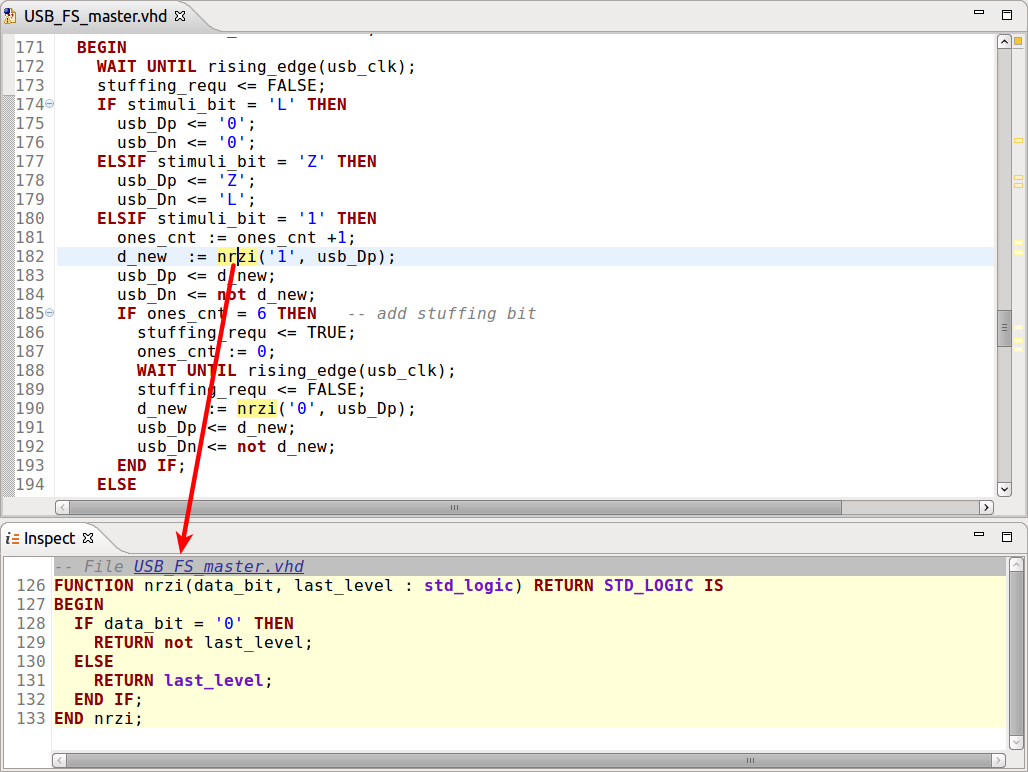
Each element shown in the Inspect View starts with an information line regarding the file and line number of the element.
The Inspect View highlights the relevant source code lines of the selected element. These lines may be surrounded with additional source code to provide a context, if necessary.
You can customize the number of lines shown by going to , or by using the key mappings detailed in the Hotkeys chapter below.
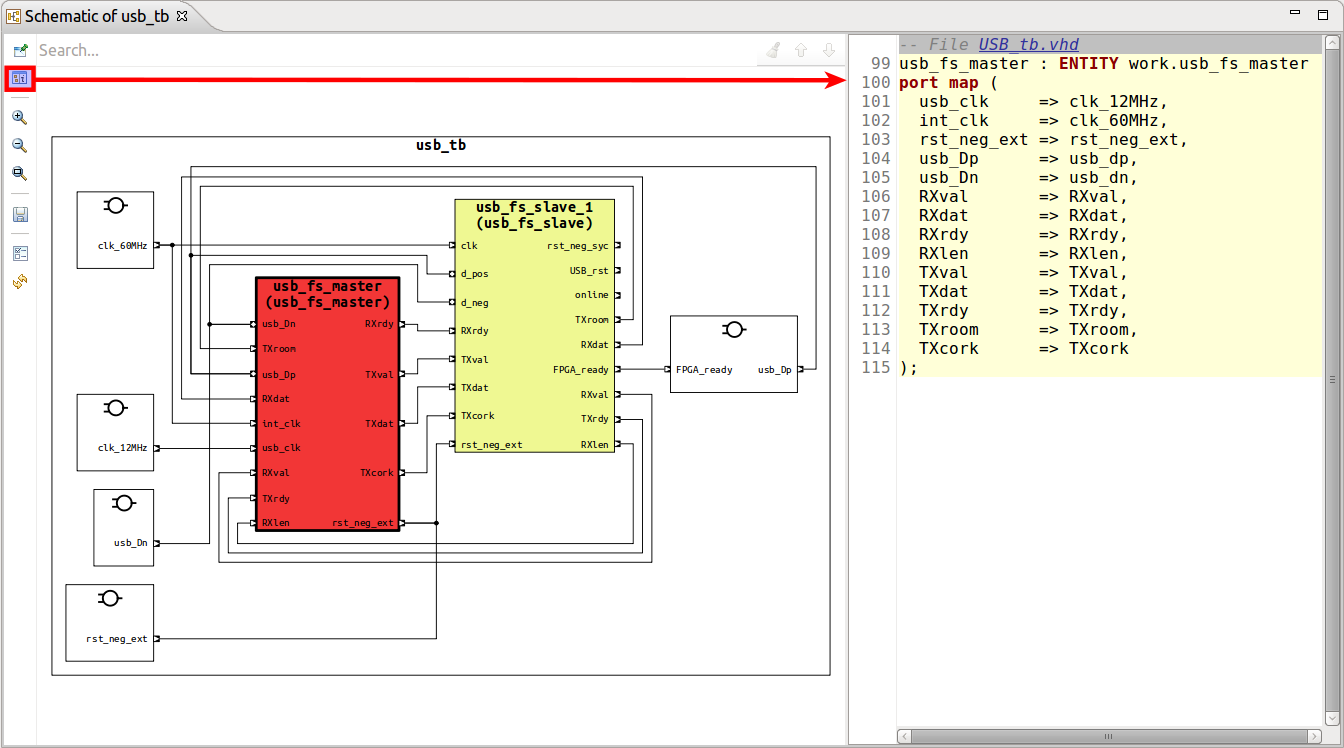
For convenience, you can see the Inspect View embedded in diagrams by clicking the Inspect Panel… button  in the toolbar.
Hotkeys
The following key mappings are available while interacting with the Inspect View.
CTRL+ALT+[ |
Decrease the number of context lines shown |
|---|---|
CTRL+ALT+] |
Increase the number of context lines shown |
CTRL+K |
Cycle through highlighted inputs shown inside the view |
WaveDrom Timing Diagrams
WaveDrom is a tool that draws timing diagrams (waveforms) from a simple textual description written in JSON. DVT renders WaveDrom waveforms in the Inspect View. The waveform diagram is updated on the fly (as you type).
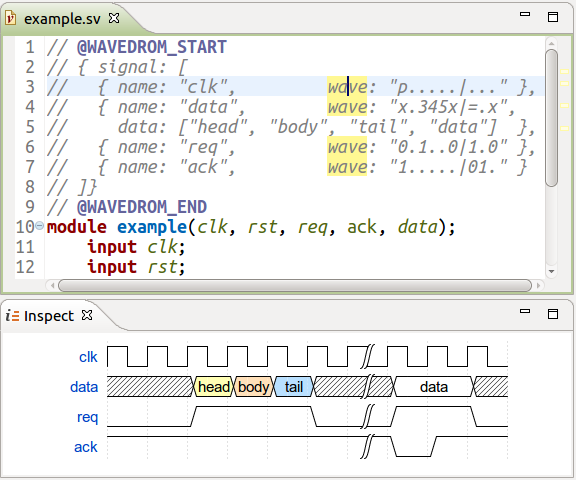
The waveform description can be:
either embedded in comments, surrounded by @WAVEDROM_START…@WAVEDROM_END pragmas
or in files with *.json or *.json5 extensions
When the waveform description is found in a file with a valid extension, the Inspect View will process it’s content and render the diagram when opened. The waveform description file can also be embedded in comments using the @WAVEDROM_FILE pragma, followed by its location. The location of the file will be solved relatively to the project root.
To save the diagram as an SVG file, right-click on it in the Inspect View.
DVT offers the ability to view WaveDrom diagrams through tooltips, by hovering over any waveform written inside DVT editors.
Tip
The WaveDrom documentation is available here.
Note
To specify additional file extensions, use the +dvt_wavedrom_file_ext_add+<extension> build config directive. To clear the extensions list use +dvt_wavedrom_file_ext_clear.
Note
To specify additional search file locations to use in junction with @WAVEDROM_FILE pragma, use the +dvt_wavedrom_files_location_add+<location> build config directive. To clear the extensions list use +dvt_wavedrom_files_location_clear.
Note
By default, only waveform descriptions of maximum 5000 characters are rendered. You can change this threshold from menu Window > Preferences then DVT > Editors.
Note
DVT uses WaveDrom version 3.5.0.
Layers View
You can quickly see all the architectures of an entity or where a function is overloaded using the Layers View.
Position the cursor on an entity, architecture or function and press Shift+F3 or right click and choose Show Layers from the menu.
The Layers View is automatically raised at any invocation. You can also open it from Window > Show View > Other… > DVT > Layers.
Double click on a layer and jump to the corresponding source location.
Right click on a layer to see its Usages.
You can use CamelCase or Simple Regex to locate a specific element.

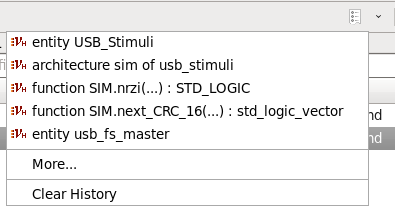
Show History List Click to see the previously inspected layers (see the image below):
Power Domain View
The Power Domain View shows detailed information about each power domain created in the project including instances, isolation strategies and retention rules.
Open the view from menu .
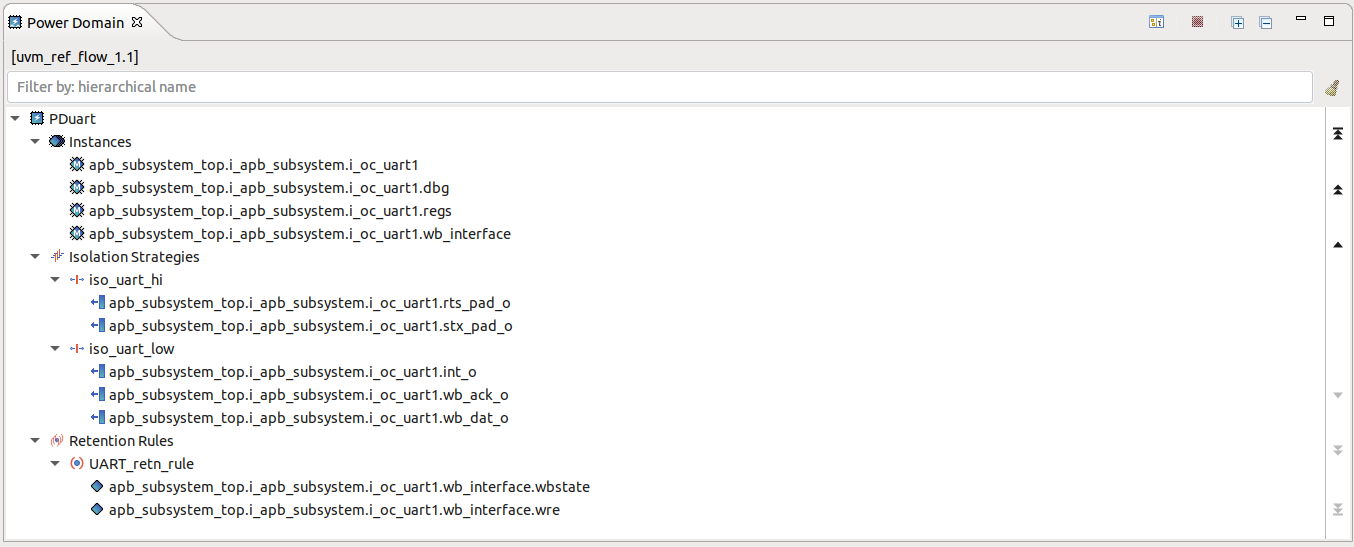
The power domains and their details are displayed in a hierarchical tree format.
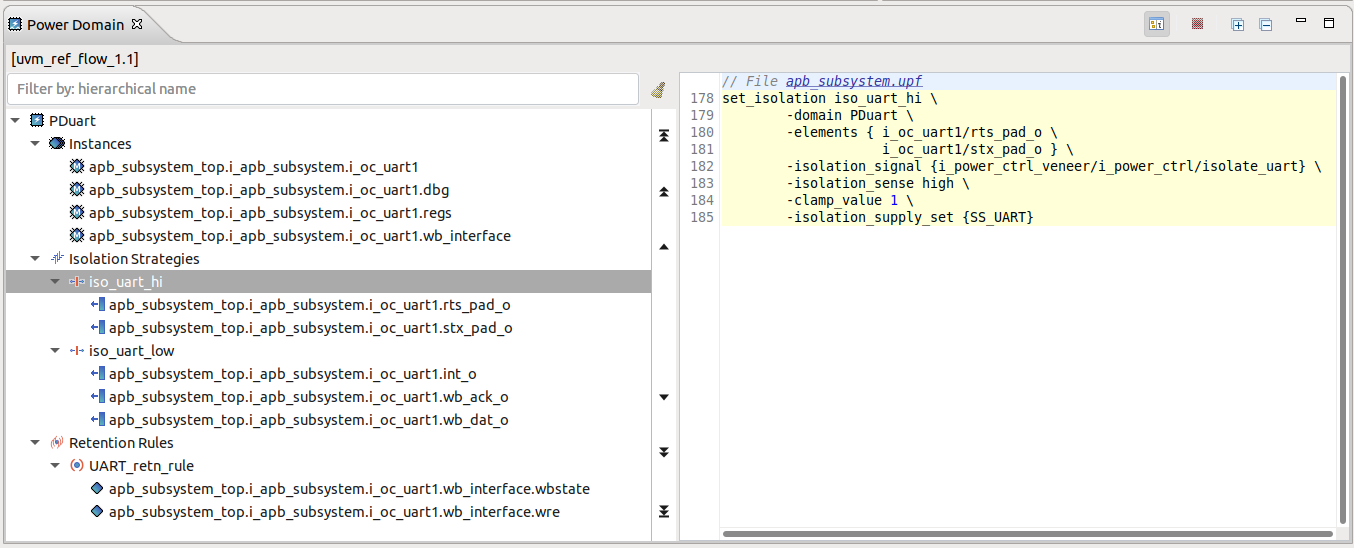
Toggle the Inspect Panel to visualize more details of the currently selected element.
Tip
Double click an element to jump to its declaration.
Tip
To see the including Power Domain of any element,
Quick Layers View
Position the cursor on the element’s name and press Ctrl+Shift+O.
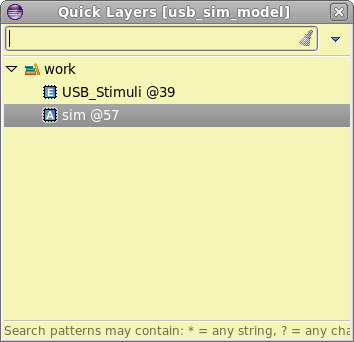
The Quick Layers View will pop-up and present a filterable list with all of the selected element’s layers.
You can use CamelCase or Simple Regex to locate a specific element.
Select a layer and press Enter or click to jump to the corresponding source location.
Outline View
The Outline View presents an overview of the editor contents.
Open the view from menu Window > Show View > Other… > General > Outline.
You can click on an entity to jump to its location inside the current file.
You can use CamelCase or Simple Regex to locate a specific element.
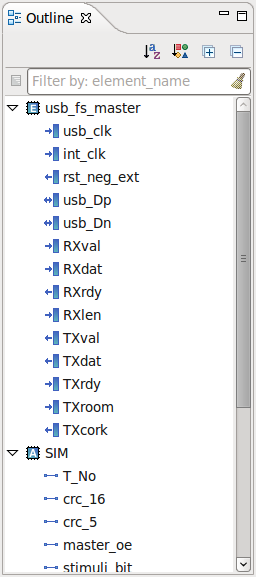

|
Filters… |
Select what elements to show |
|---|---|---|

|
Alphabetical Sort |
If alphabetical sort is on, all the entities are sorted by name. By default the entities are presented in the definition order. |

|
Category Sort |
If category sort is on, entities are arranged by categories (fields, methods etc.), instead of being mixed as they appear in the file. |

|
Expand All |
|

|
Collapse All |
Quick Outline View
Press Ctrl+O to open the Quick Outline dialog. It presents an overview of your file.
You can use CamelCase or Simple Regex to locate a specific element.
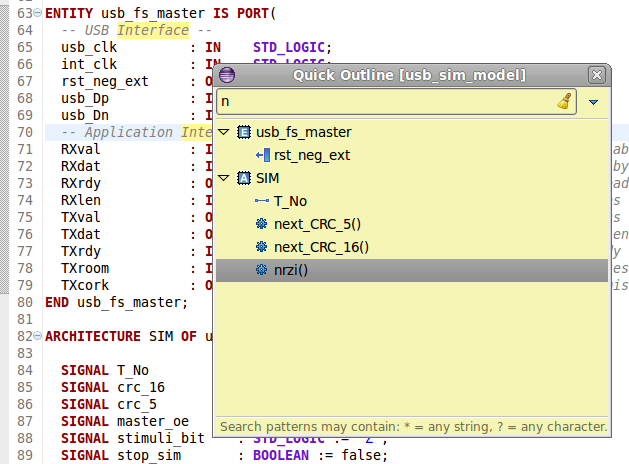
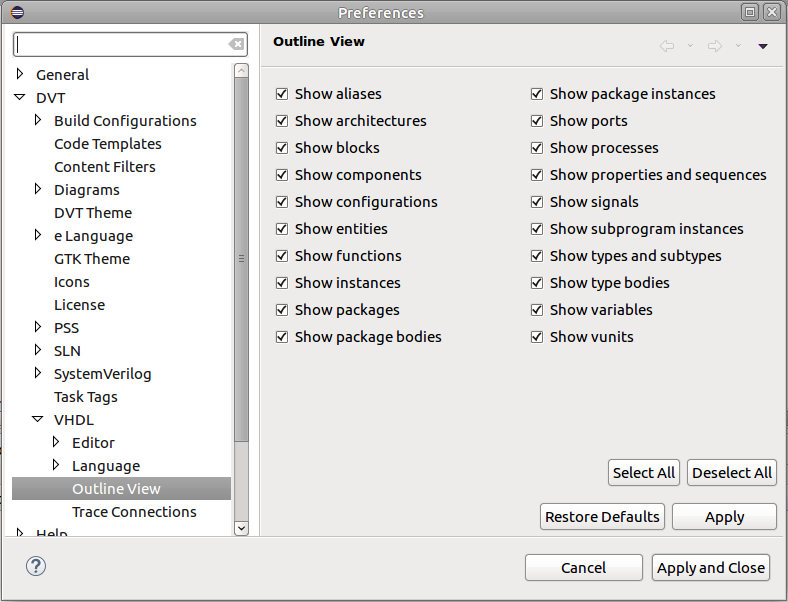
Outline View Preferences
You can configure the Outline View contents from menu Window > Preferences > DVT > VHDL > Outline View.
Problems View
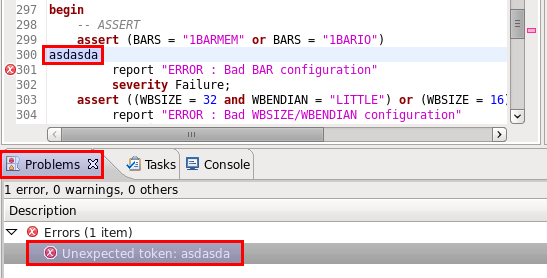
If a project contains errors, for example syntax errors, it will be indicated using decorators:
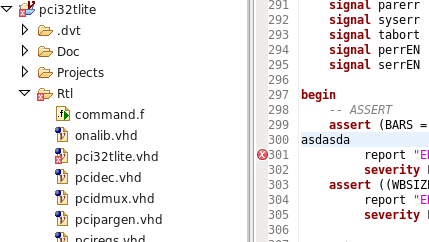
You can use the Problems View to inspect the errors. Open the view from menu Window > Show View > Other… > General > Problems. Double clicking on some error will jump to the source location.
Quick Query View
Press Ctrl+Alt+Q to quickly open the Quick Query View, which provides a filterable list of all the types and compiled files in the project.
This view supports semantic search, allowing to look for a specific element. In order to do this, structure your query in the following manner: query_key:search_pattern.
You can use CamelCase or Simple Regex for the search_pattern.
Tip
Use Content Assist to see all the available query keys (CTRL+Space).
DVT supports the following query keys:
architecture
configuration
entity
file
library
package
package_body
type
type_body
vhdl_type
Note
You can use the type:search_pattern query in order to search for all the types defined in your project.
Select an element and press Enter or click to navigate to it.
Note
By default, the Quick Query View will display 100 items from each category (types, files). You can customize this value by going to .
Tasks View
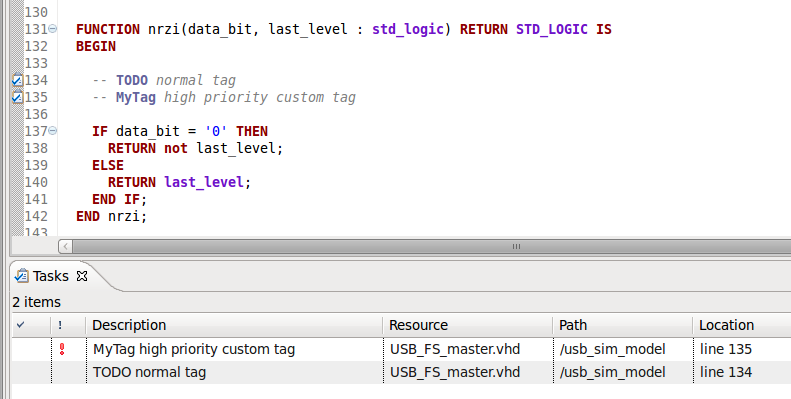
You can embed reminders in your source files by adding comments prefixed by certain “keywords” called task tags.
There are three predefined tags:
FIXME - high priority
TODO - normal priority
XXX - low priority
All reminders are listed in the Tasks View. If it is not visible, open the view from menu Window > Show View > Other > General > Tasks.
Double click on a task to jump to the marker definition.
You can define custom reminder tags and assign them priorities:
Navigate to Window > Preferences > DVT > Task Tags
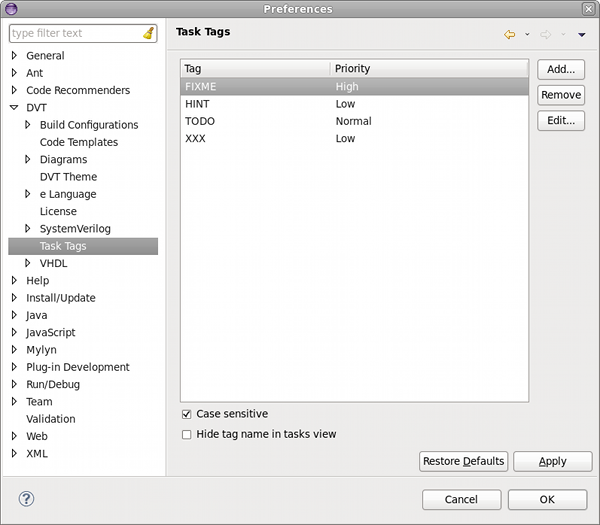
You can specify if the tags should be considered case-sensitive and if the tag name should be displayed in Tasks View.
Click the Add… button on the right, enter the name of your tag and select its priority
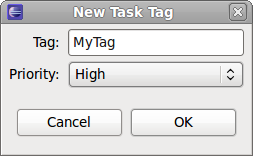
Click OK in the New Task Tag and Preferences dialogs
DVT will recognize the new tag and highlight it in code comments.
Note
it is recommended to rebuild the project so that DVT rescans all files for reminders.
Trace Connections View
The Trace Connections View presents a hierarchy similar with the Design Hierarchy View:
The connected instances are displayed, the rest are filtered out.
You can use Show Root and Show Full Hierarchy options to show the entire design. The connected instances are colored, the rest are grayed-out.
Port icons indicate the direction of the signal.
Sources and destinations are marked with red/green decorations.
You can search for a specific connected instance or signal with Quick Search in Views.
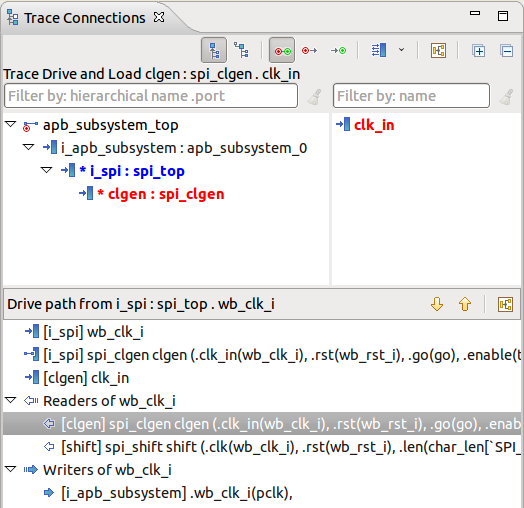
The toolbar buttons allow you to change the trace kind:
 Trace Drive and Load shows the connected instances across the drive and load paths (how is this signal connected in the design)?
 Trace Drive shows the connected instances across the drive paths (who drives this port?).
 Trace Load shows the connected instances across the load paths (who does this port drive?).
Other buttons:
 Show Root shows the path to the hierarchy root, even if the signal doesn’t reach it. It provides the enclosing context for deep traces, for example when tracing a signal many levels below the top module. This option is enabled by default.
 Show Full Hierarchy shows the full hierarchy, whether it is reached by the traced signal or not (how is this signal connected in the whole design context?).
 Show As List to view only the sources and destinations as a list.
 Show/Hide Signals shows or hides the ports or internal signals of the currently selected instance.
 Show Diagram to view a graphical representation of signal traces.
At any time you can see the traced signal (the port or internal signal you are currently tracing). It is indicated in the info label. The two connected instances that are bold colored in the tree represent:
The instance with the traced signal.
The instance with the signal shown in the trace path. More details Trace Path.
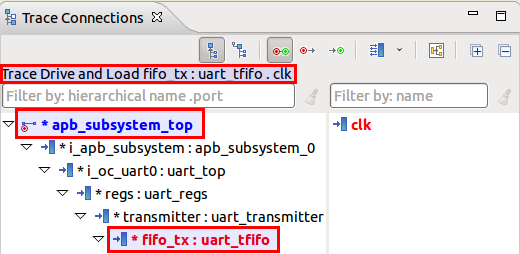
Double-click on an element to go to code:
For a connected instance, go to its declaration.
For a port, go to where it is connected in the trace path.
For a signal, go to where it is declared.
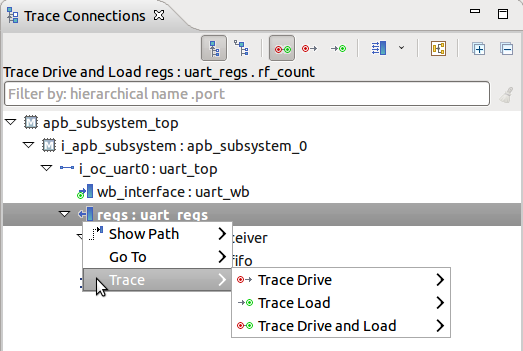
When the signals panel is hidden, right-click on an instance in the tree to show the context menu.
When visible, right-clicking on a port or internal signal to show the context menu.
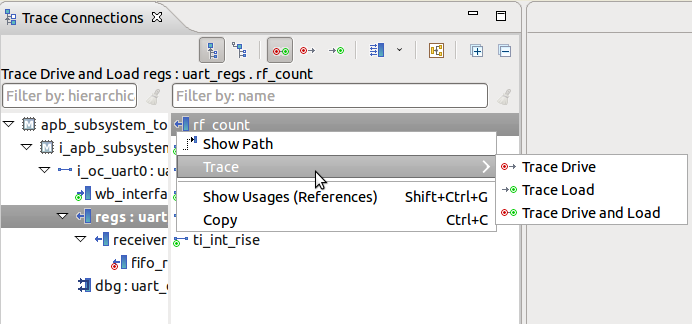
The options in the context menu are :
Trace > trace kind Trace signals found on the drive or load paths of the current traced signal.
Go to Go to the port connections or signal declarations of the selected instance. The same as double-clicking on a particular signal in the signals panel.
Show Path Show the trace path from the traced port to the selected port or internal signal. More details Trace Path.
Types View
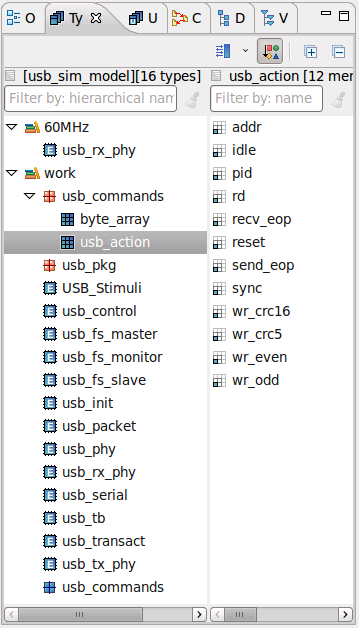
The Types View presents all the types (classes, structs, units, entities etc.) defined in your project.
Open the view from menu .
Click on the Show Members button to show the Members pane.
Double click on a type or type member to jump to its definition.
Right click on a type or type member to search for Show Usages, Readers or Writers or further inspect the Type Hierarchy View or the Verification Hierarchy View, where applicable.
You can perform Search for Members.
Toolbar |
||
|---|---|---|

|
Show/Hide Members |
Toggles the visibility of the members pane. Use the drop-down to chose placement (to the right side or below the types tree). |

|
Sort by Category |
Click to sort by category. Default sort order is alphabetical. |

|
Expand All |
Expand all nodes in types tree. |

|
Collapse All |
Collapse all nodes in types tree. |
Note
Type containers are also shown in the view, for example libraries, generate statements, etc. See this for more information on Types, Type Containers and Type Members.
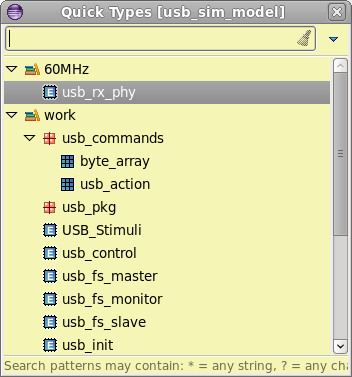
Quick Types View
Press Ctrl+Shift+T to quickly open a specific type definition for the project associated with the active editor or the current selected project from the Navigator (if no editor is open).
The Quick Types View will pop-up and and present a filterable list of all the types in the project associated with the active editor or the current selected project from the Navigator (if no editor is open).
You can use CamelCase or Simple Regex to locate a specific element.
Select and press Enter or click to jump to its definition.
