Views
Checks View
The Checks View presents all the check that, expect, assert and assume constructs in the project.
Open the view from menu Double click on a check and jump to the source location.

|
check that |

|
assert |

|
expect |

|
assume |
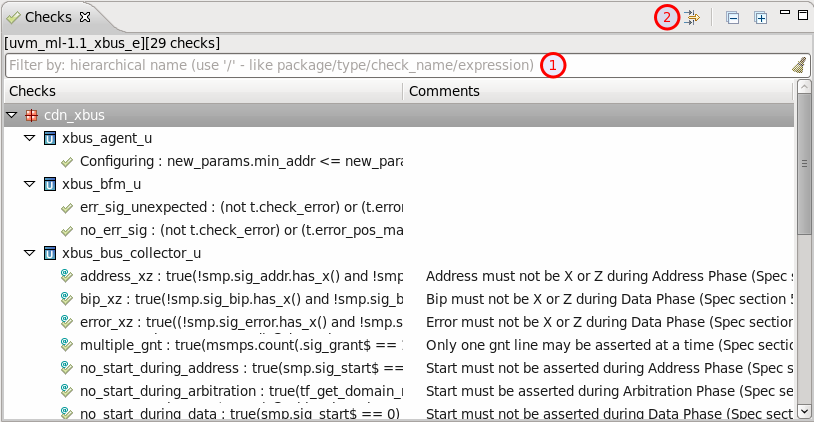
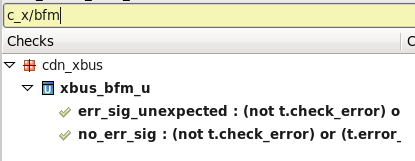
Quick Search. You can use CamelCase, Simple Regex or Hierarchical Search to locate a specific element. By default, hierarchical search will show all descendants:
Check Kind Filters. You may choose to hide assertions, assumptions, checks or expects - see the image below:

Code Templates View
The Code Templates is located near the Navigator and Hierarchy views or you can open it from .
To insert a template in a code editor, you can either:
drag and drop it in the editor at a specific location
double click on it
click on Insert into editor button
right-click on it > Insert
Note
If you choose one of the last three actions mentioned above, the template will be inserted in the current editor at the current cursor’s positon. Please make sure you have an opened editor and the cursor is at the right position before adding the template!
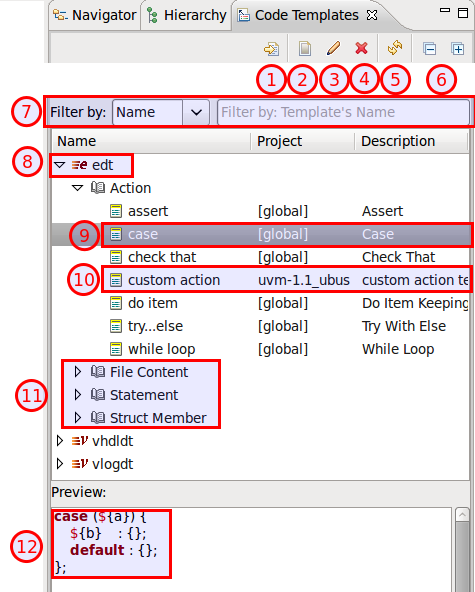
Insert the selected template into the current editor
Create a new template
Edit the selected template
Remove the selected template (NOTE: you cannot undo this operation!)
Refresh the view (if it doesn’t automatically update when you modify templates/projects etc.)
Collapse/expand all
Filter templates (you can filter them by: nature, context, name, project, description)
Templates’ natures
Templates’ contexts
Preview the template’s pattern (it automatically updates when clicking on a template)
To create a new template, click on Create a New Template button on the toolbar:
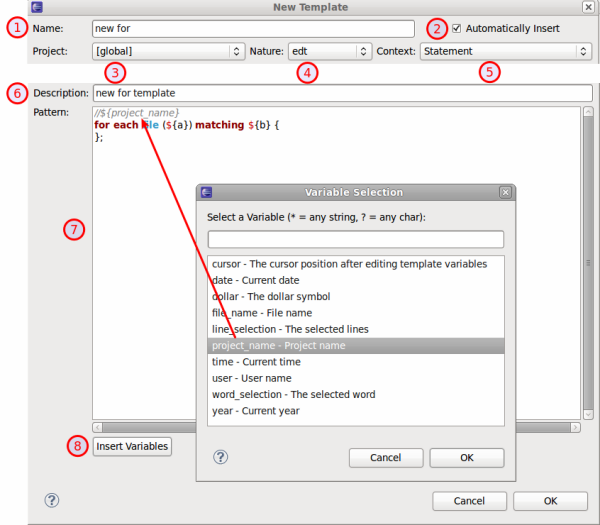
Template’s name
Check Automatically insert if you want the template to expand automatically on Ctrl+Space when there is no other matching template available. It is usually good idea to leave the checkbox checked, otherwise you would get a template proposal “popup”
Each template must be created under a project available in the current workspace (select [ global ] for a global template)
Assign a nature - only natures relevant to the selected project will be displayed
Template’s context - only contexts relevant to the selected nature will be displayed
Templates’s description
Code Pattern - embed variables in ${} e.g. ${variable_name} to enable the template proposal wizard when inserting the template into an editor
Insert variables - here you can find some useful misc. predefined variables
Compile Order view
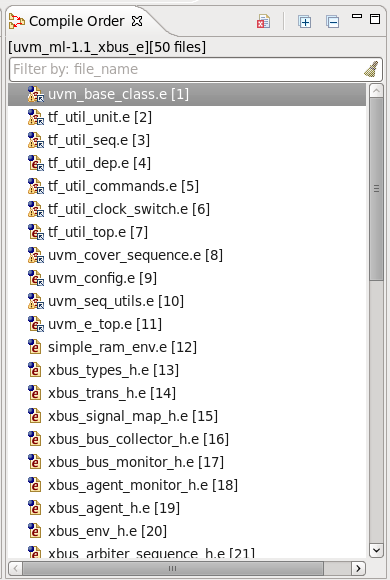
The Compile Order View presents the hierarchy of compiled files as it results from the `include compiler directives, starting from the project top files.
Open the view from menu .
Double click on a file to open it.
You can use CamelCase or Simple Regex to locate a specific element.

|
A file that is not part of the current project (files are not under the project directory). |
|---|---|

|
A file in your project. |
Right click on a module then Go To Import to jump to the import location. If the module is imported multiple times, a file selection dialog will pop-up.
Build Config Hierarchy
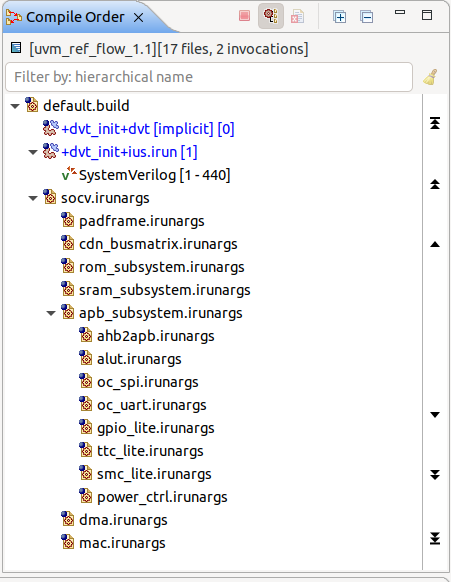
Press Show Build Config button to open the build config hierarchy as it results from the ‘-f’ compile directives, starting from the active build configuration.

Note
Each invocation section will be added under the coresponding build configuration file.
Quick Compile Order View
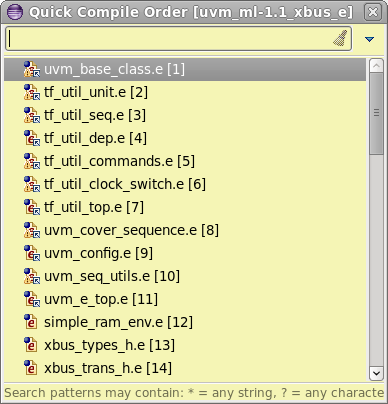
Press Ctrl+I to quickly open a compiled file.
The Quick Compile Order View will pop-up and and present a filterable list of all the compiled files in the project.
You can use CamelCase or Simple Regex to locate a specific element.
Select a file and press Enter or click to open it.
Console View
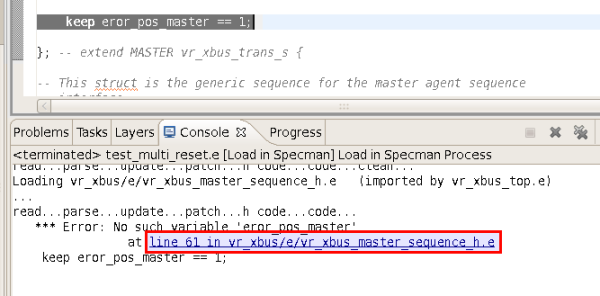
Any invocation (for example a DVT Generic run) output is dumped to the Console View.
The Console View is automatically raised at any invocation.You can also go to menu to open the Console View.
Click on hyperlinks in the Console View to jump directly to the to source location.
Coverage View
The Coverage View presents all the coverage groups and items in your project.
Open the view from menu .
Double click on a group or item and jump to the source location.

|
cover group |

|
simple item |

|
cross item |

|
transition item |
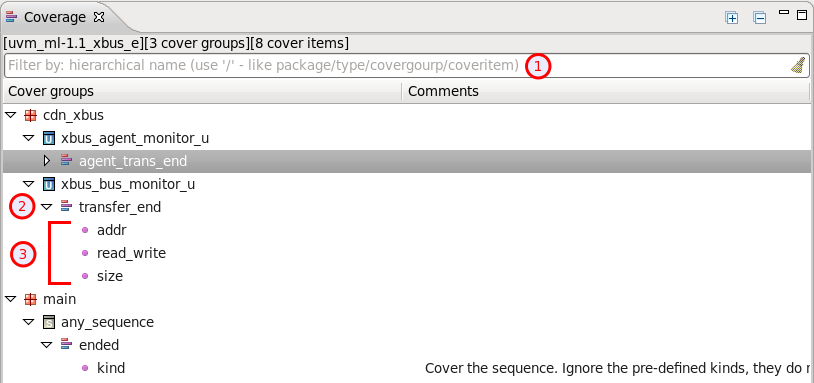
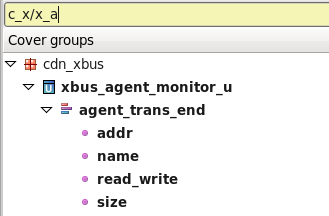
Quick Search. You can use CamelCase, Simple Regex or Hierarchical Search to locate a specific element. By default, hierarchical search will show all descendants:
Cover Group.
Cover Items.
Call Hierarchy View
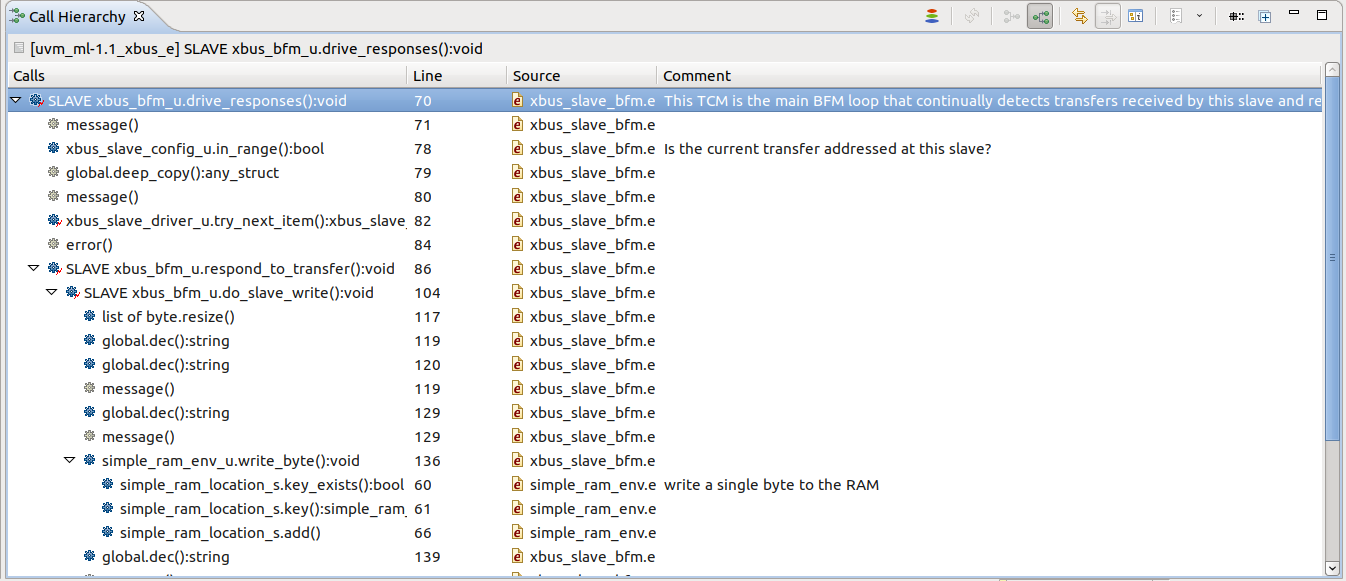
The Call Hierarchy view presents the call tree of a method or TCM.
Place the editor cursor on a method definition or method call, right-click, and choose , or press Ctrl+Alt+H.
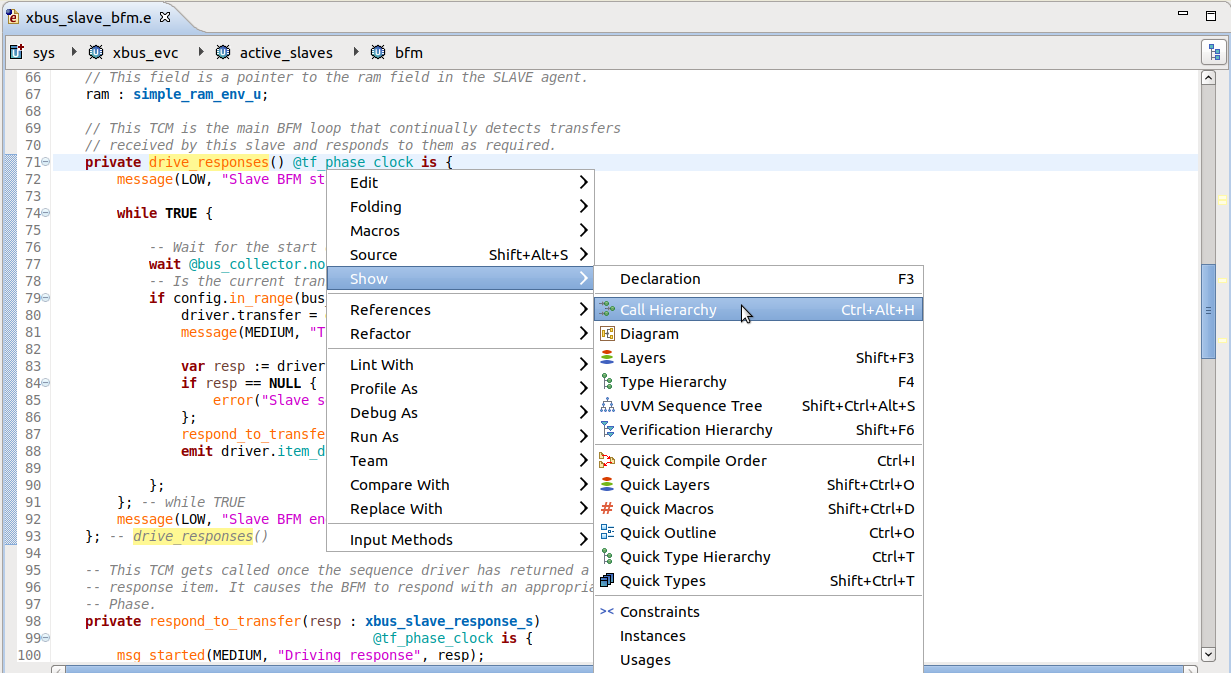
You can expand nodes in the tree to further inspect the hierarchy.
Tip
Double click on any node to jump to the method call.
Tip
Use Up and Down arrow keys to navigate the view, Left to collapse and Right to expand.
Tip
Right-click on a node to:
Remove from View Remove selected node from the tree.
Expand Children Expand all children of the selected node.
Expand Multiple Levels Expand a custom number of levels from the selected node.
Go to Declaration Jump to the declaration of the selected method.
Toolbar

|
Caller Hierarchy |
Switch strategy to caller (disabled, only available for SystemVerilog). |

|
Callee Hierarchy |
Switch strategy to callee. Also refreshes the view. |

|
Refresh View |
Recompute the call tree if dirty (see below). |

|
Link with editor |
Link tree selection with editor. |

|
History |
Shows a list of methods on which Call Hierarchy was most recently called. |

|
Prepend Package Name |
Show package name in labels. |

|
Expand Multiple Levels |
Expand a custom number of levels. |

|
Toggle Inspect Panel |
Show/hide the inspect panel embedded in the view. |

|
Analyze all root method extensions |
Analyzes root method extensions. |
Icons

|
Method call or method definition |

|
Predefined method call |
TCM |
Refresh
The Call Hierarchy view is not automatically updated at incremental build.
When you decide it’s time to recompute the view contents, simply click the Refresh toolbar button.

Note
Refresh may not retain the state of the method call tree.
Inspect View
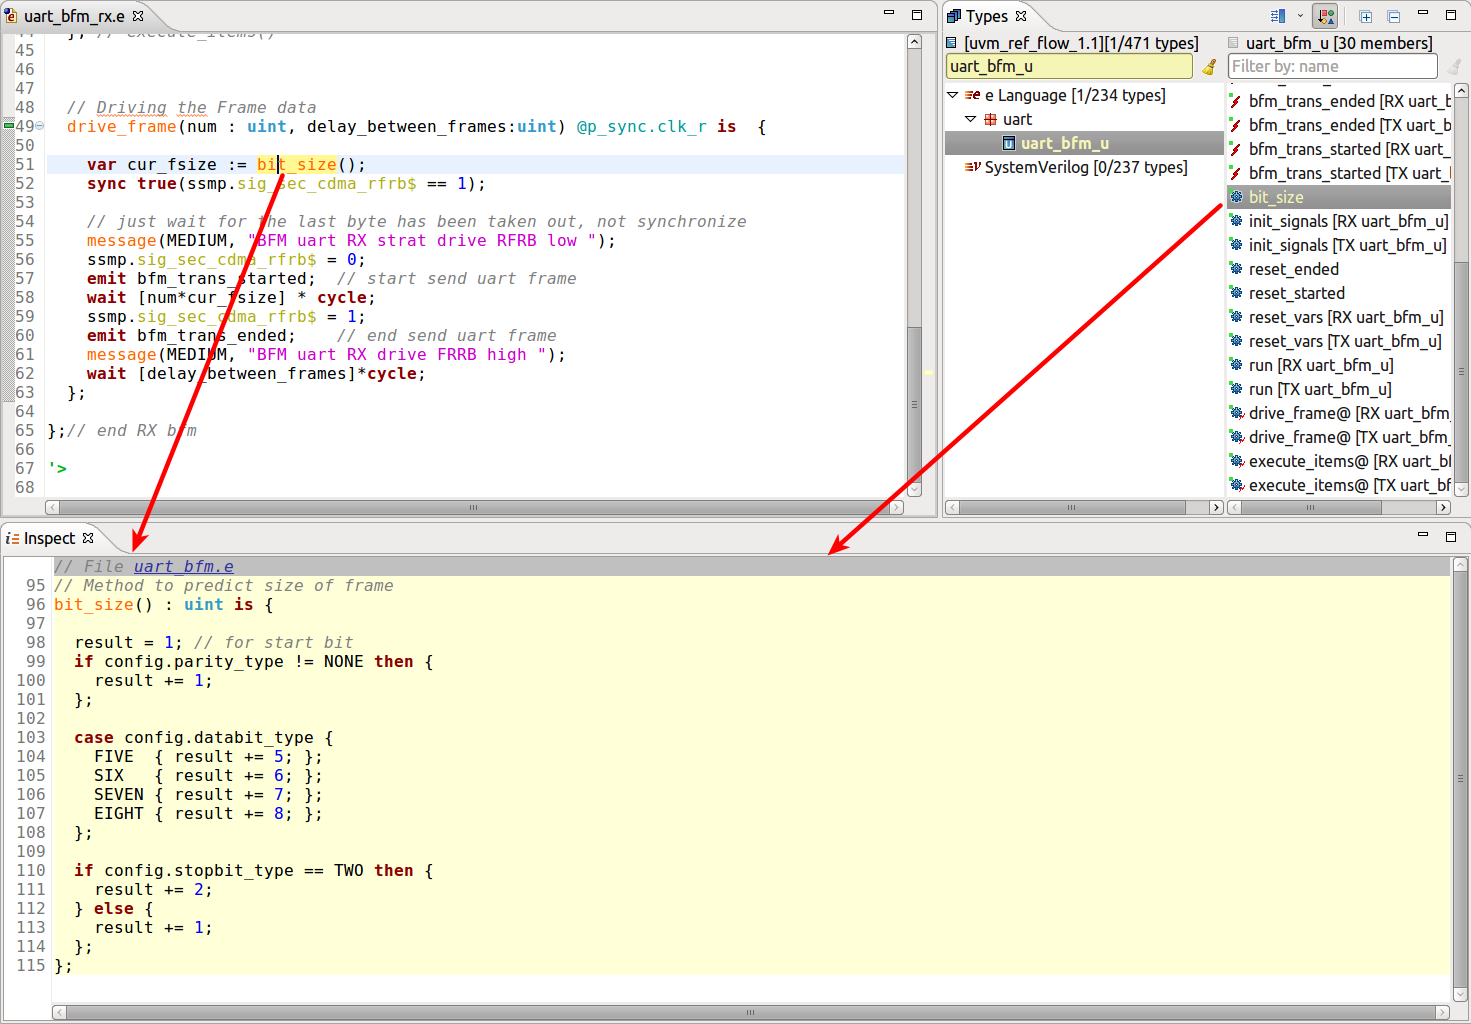
Inspect View shows detailed information about various elements in DVT.
Open the view from menu .
To inspect an element, simply select it in a view or click on its name in the editor.
Information about the selected element will be presented in the view.
Each element shown in the Inspect View starts with an information line regarding the file and line number of the element.
The Inspect View highlights the relevant source code lines of the selected element. These lines may be surrounded with additional source code to provide a context, if necessary.
You can customize the number of lines shown by going to , or by using the key mappings detailed in the Hotkeys chapter below.
WaveDrom Timing Diagrams
Hotkeys
The following key mappings are available while interacting with the Inspect View.
CTRL+ALT+[ |
Decrease the number of context lines shown |
CTRL+ALT+] |
Increase the number of context lines shown |
CTRL+K |
Cycle through highlighted inputs shown inside the view |
WaveDrom is a tool that draws timing diagrams (waveforms) from a simple textual description written in JSON. DVT renders WaveDrom waveforms in the Inspect View. The waveform diagram is updated on the fly (as you type).
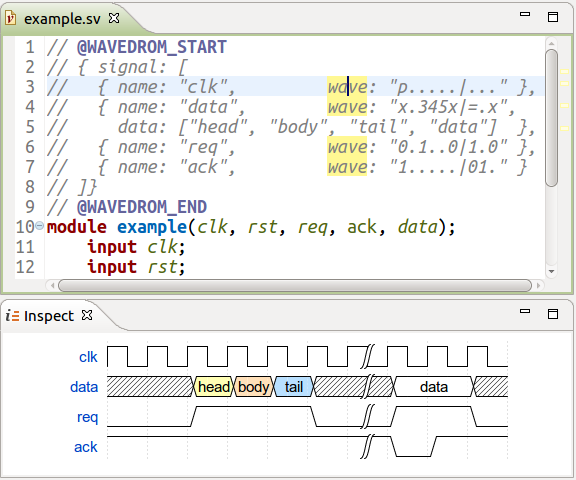
The waveform description can be:
either embedded in comments, surrounded by @WAVEDROM_START…@WAVEDROM_END pragmas
or in files with *.json or *.json5 extensions
When the waveform description is found in a file with a valid extension, the Inspect View will process it’s content and render the diagram when opened. The waveform description file can also be embedded in comments using the @WAVEDROM_FILE pragma, followed by its location. The location of the file will be solved relatively to the project root.
To save the diagram as an SVG file, right-click on it in the Inspect View.
DVT offers the ability to view WaveDrom diagrams through tooltips, by hovering over any waveform written inside DVT editors.
Tip
The WaveDrom documentation is available here.
Note
To specify additional file extensions, use the +dvt_wavedrom_file_ext_add+<extension> build config directive. To clear the extensions list use +dvt_wavedrom_file_ext_clear.
Note
To specify additional search file locations to use in junction with @WAVEDROM_FILE pragma, use the +dvt_wavedrom_files_location_add+<location> build config directive. To clear the extensions list use +dvt_wavedrom_files_location_clear.
Note
By default, only waveform descriptions of maximum 5000 characters are rendered. You can change this threshold from menu Window > Preferences then DVT > Editors.
Note
DVT uses WaveDrom version 3.5.0.
Layers View
The e Language aspect oriented programming (AOP) capabilities allows you to “extend” some entities, for example a struct using extend or when, a method using is also, is first etc.. The definition of some entity might end up being spread over multiple files.
The Layers View provides a compact presentation of all the extensions (layers) of a specific entity. The layers are ordered according to the compile order as computed from imports in top files and test files.
Position the cursor on the entity name and press Shift+F3 or right click and chose from the menu.
The Layers View is automatically raised at any invocation. You can also open it from .
Double click on a layer and jump to the corresponding source location.
You can use CamelCase or Simple Regex to locate a specific element.

Collect Layers. Applicable only for methods. Collects the source code from all method layers and dumps it to a temporary file.
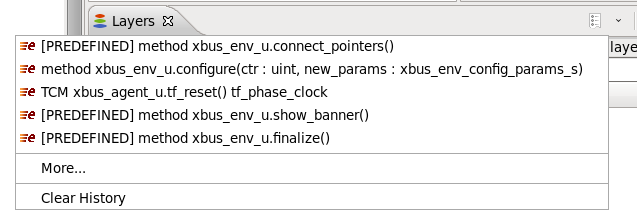
Show History List. Click to see the previously inspected layers (see the image below):
In case of layers for a struct/unit you can right click and further inspect the Type Hierarchy View or the Verification Hierarchy View.
Sometimes you might want see the layers of the type of a field, the layers of the return type of a method or the layers of the type of the elements in a list. Just place the cursor on the element and press Shift+F3 twice (first time you will see the layers of the element, and second time the layers of its “associated” type, as defined above).
Quick Layers View
Position the cursor on the element’s name and press Ctrl+Shift+O.
The Quick Layers View will pop-up and present a filterable list with all of the selected element’s layers.
You can use CamelCase or Simple Regex to locate a specific element.
Select a layer and press Enter or click to jump to the corresponding source location.
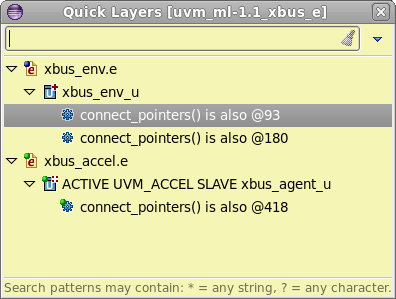
Similar to the layers view, you can quickly inspect the “associated” type of an element by pressing the shortcut key twice.
Macros View
The Macros View presents all the preprocessing macros in the project (including define as and define as computed).
Open the view from menu .
Double click on a macro to jump to its definition.
Right click on a macro to view its Layers and Usages.
You can use CamelCase or Simple Regex to locate a specific element.

|
Preprocessing define |
|---|---|

|
Preprocessing undefine |

|
Preprocessing ifdef, ifndef |

|
Define As Macro |

|
Define As Computed Macro |

|
Define As Macro Match |

|
Define As Computed Macro Match |
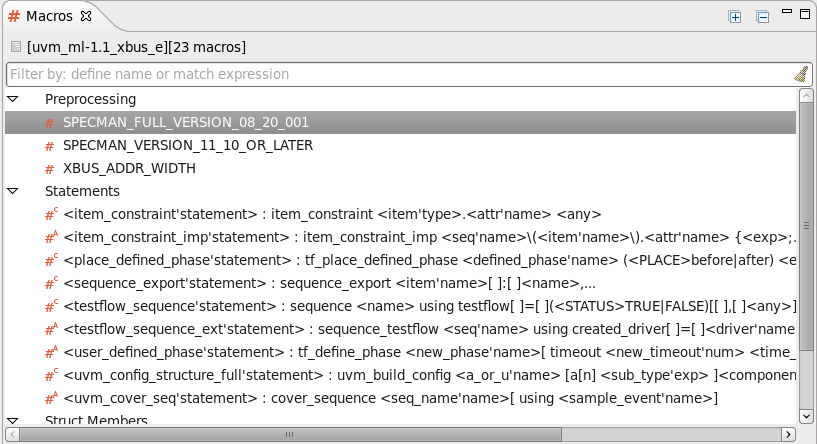
Quick Macros View
Press Ctrl+Shit+D to quickly jump to a specific macro definition.
The Quick Macros View will pop-up and and present a filterable list of all the preprocessing macros in the project associated with the active editor or the current selected project from the Navigator (if no editor is open).
You can use CamelCase or Simple Regex to locate a specific element.
Select a macro and press Enter or click to jump to its definition.
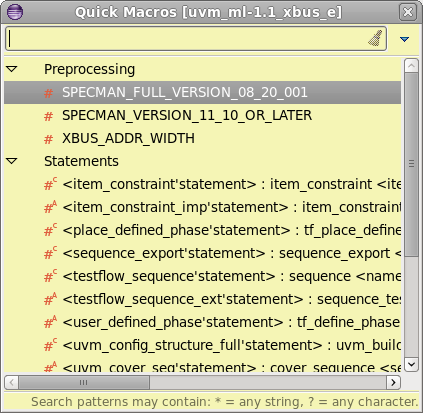
Outline View
The Outline View presents an overview of the editor contents.
Open the view from menu Window > Show View > Other… > General > Outline.
You can click on an entity to jump to its location inside the current file.
You can use CamelCase or Simple Regex to locate a specific element.
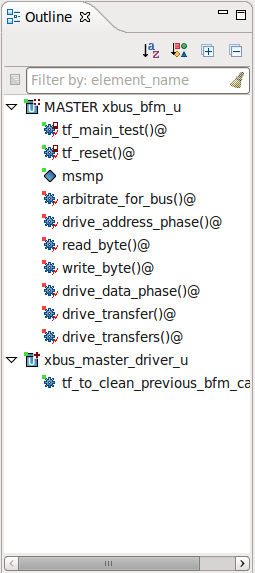

|
Filters… |
Select what elements to show |

|
Alphabetical Sort |
If alphabetical sort is on, all the entities are sorted by name. By default the entities are presented in the definition order. |

|
Category Sort |
If category sort is on, entities are arranged by categories (fields, methods etc.), instead of being mixed as they appear in the file. |

|
Expand All |
|

|
Collapse All |
Quick Outline View
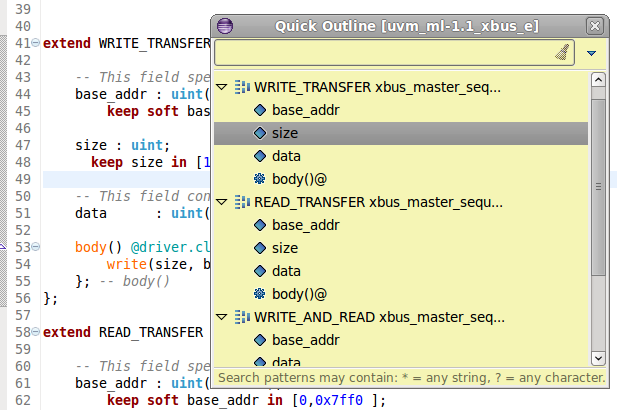
Press Ctrl+O to open the Quick Outline dialog. It presents an overview of your file.
You can use CamelCase or Simple Regex to locate a specific element.
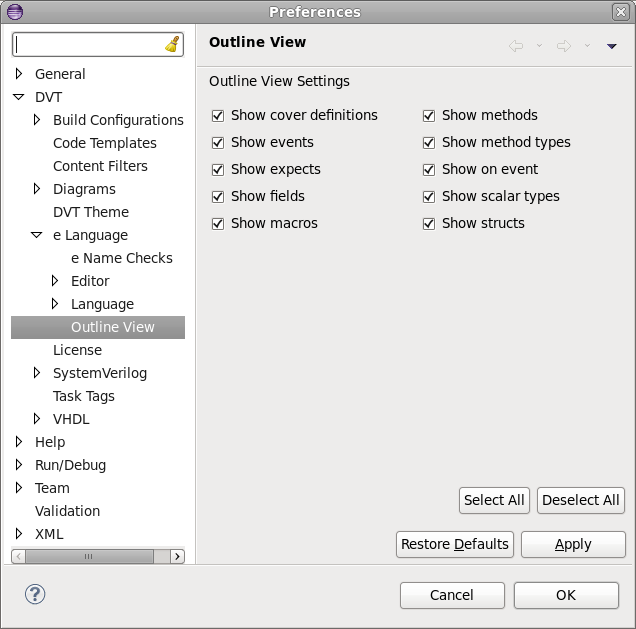
Outline View Preferences
You can configure the Outline View contents from menu Window > Preferences > DVT > e Language > Outline View.
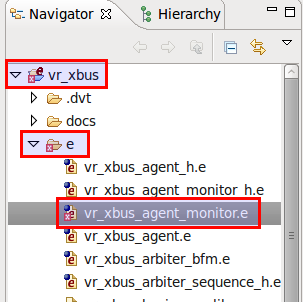
Problems View
If a project contains errors, for example syntax errors, it will be indicated using decorators:
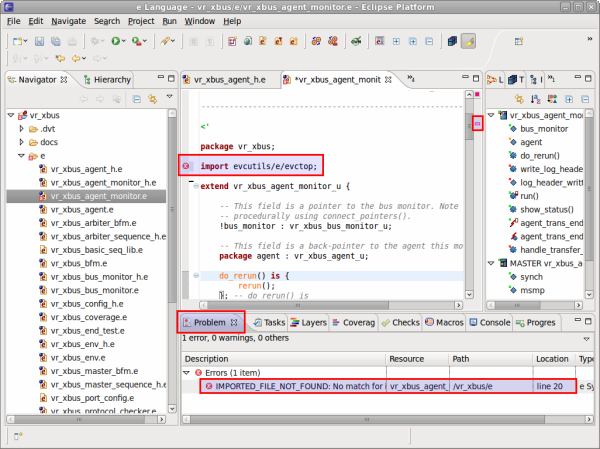
You can use the Problems View to inspect the errors. Open the view from menu Window > Show View > Other… > General > Problems. Double clicking on some error will jump to the source location.
Quick Query View
Press Ctrl+Alt+Q to quickly open the Quick Query View, which provides a filterable list of all the types, macros and compiled files in the project.
This view supports semantic search, allowing to look for a specific element. In order to do this, structure your query in the following manner: query_key:search_pattern.
You can use CamelCase or Simple Regex for the search_pattern.
Tip
Use Content Assist to see all the available query keys (CTRL+Space).
DVT supports the following query keys:
file
macro
package
scalar_type
sequence
struct
type
unit
Note
You can use the type:search_pattern query in order to search for all the types (structs, units etc.) defined in your project.
Additionally, there are UVM-specific queries that have the following format: uvm_class_name:search_pattern, where uvm_class_name is one of the following:
any_port
any_sequence
any_sequence_driver
any_sequence_item
uvm_agent
uvm_agent_config
uvm_bfm
uvm_collector
uvm_config_params
uvm_driver
uvm_env
uvm_env_config
uvm_mem
uvm_monitor
uvm_reg
uvm_reg_file
uvm_reg_map
uvm_scoreboard
uvm_sequence
uvm_sequence_item
uvm_signal_map
vr_ad_map
vr_ad_mem
vr_ad_reg
vr_ad_reg_file
Select an element and press Enter or click to navigate to it.
Note
By default, the Quick Query View will display 100 items from each category (types, macros, files). You can customize this value by going to .
Tasks View
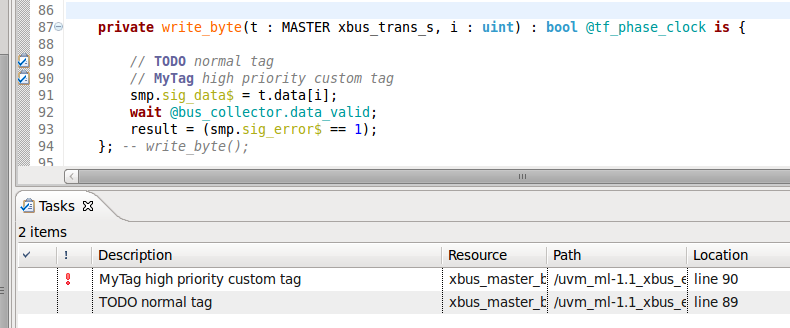
You can embed reminders in your source files by adding comments prefixed by certain “keywords” called task tags.
There are three predefined tags:
FIXME - high priority
TODO - normal priority
XXX - low priority
All reminders are listed in the Tasks View. If it is not visible, open the view from menu Window > Show View > Other > General > Tasks.
Double click on a task to jump to the marker definition.
You can define custom reminder tags and assign them priorities:
Navigate to Window > Preferences > DVT > Task Tags :
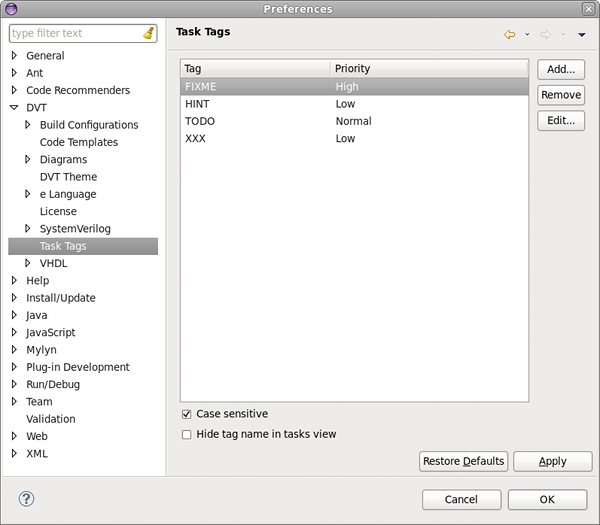
You can specify if the tags should be considered case-sensitive and if the tag name should be displayed in Tasks View.
Click the Add… button on the right, enter the name of your tag and select its priority
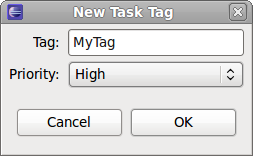
Click OK in the New Task Tag and Preferences dialogs
DVT will recognize the new tag and highlight it in code comments.
Note
It is recommended to rebuild the project so that DVT rescans all files for reminders.
Types View
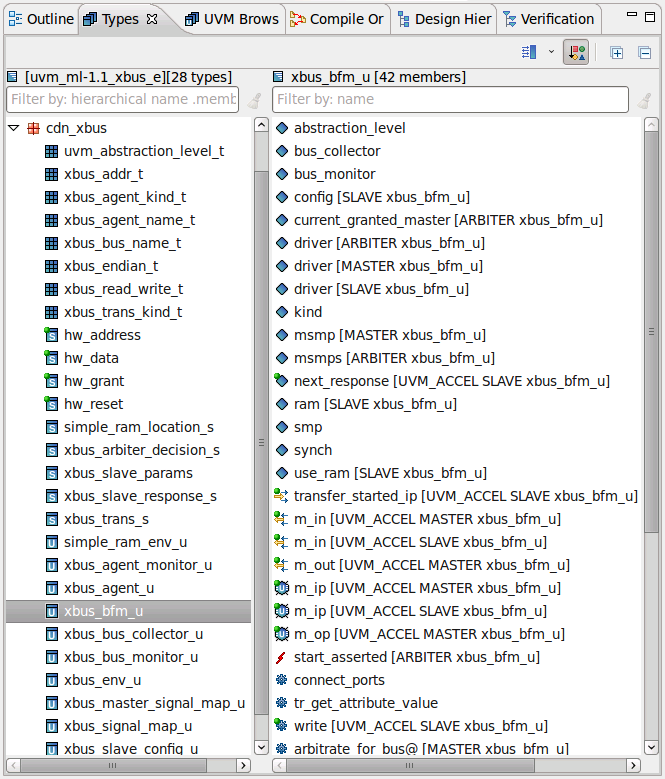
The Types View presents all the types (classes, structs, units, entities etc.) defined in your project.
Open the view from menu Window > Show View > Other… > DVT > Types.
Click on the Show Members button to show the Members pane.
Double click on a type or type member to jump to its definition.
Right click on a type or type member to search for Search for References (Usages, Readers or Writers) or further inspect the Type Hierarchy View or the Verification Hierarchy View, where applicable.
You can perform Search for Members.
Toolbar |
||
|---|---|---|

|
Show/Hide Members |
Toggles the visibility of the members pane. Use the drop-down to chose placement (to the right side or below the types tree). |

|
Sort by Category |
Click to sort by category. Default sort order is alphabetical. |

|
Expand All |
Expand all nodes in types tree. |

|
Collapse All |
Collapse all nodes in types tree. |
Note
Type containers are also shown in the view, for example libraries, generate statements, etc. See this for more information on Types, Type Containers and Type Members.
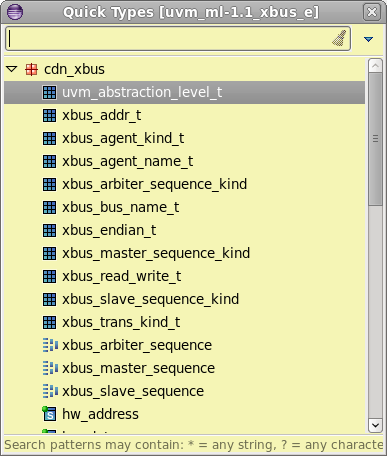
Quick Types View
Press Ctrl+Shift+T to quickly open a specific type definition for the project associated with the active editor or the current selected project from the Navigator (if no editor is open).
The Quick Types View will pop-up and and present a filterable list of all the types in the project associated with the active editor or the current selected project from the Navigator (if no editor is open).
You can use CamelCase or Simple Regex to locate a specific element.
Select and press Enter or click to jump to its definition.
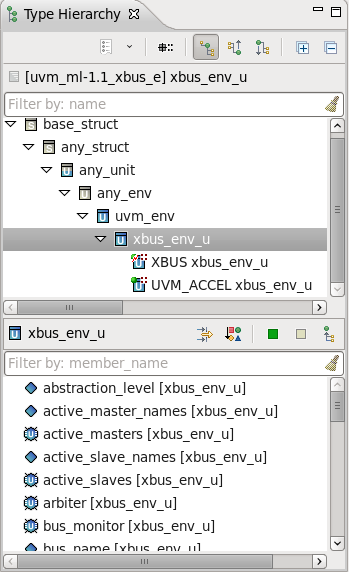
Type Hierarchy View
The Type Hierarchy View presents the like-inheritance and the members of a struct or unit.
Position the cursor on the element name and press F4 or right click and choose Type Hierarchy from the menu.
The Type Hierarchy View is automatically opened at any invocation. You can also open it from .
You can right click in the inheritance tree and further inspect the Type Hierarchy or see Usages.
You can use CamelCase or Simple Regex to locate a specific element.
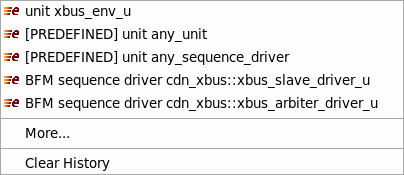
 Show History List
Click to see the previously inspected types:
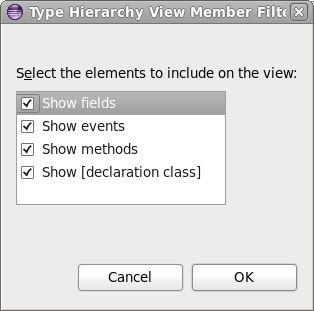
 Filters…
Select what members to show (methods, fields, events etc.):
Quick Type Hierarchy View
You can quickly inspect and jump to a specific parent or child in the hierarchy. Press Ctrl+T with the cursor positioned on the element name.
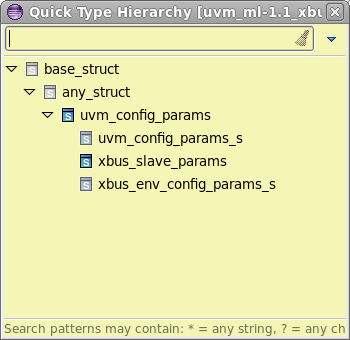
The Quick Type Hierarchy View will pop-up and present a filterable list with all of the selected element’s hierarchy.
You can use CamelCase or Simple Regex to locate a specific element.
Select and press Enter or click to jump to the corresponding source location.
Tip
While the Quick Type Hierarchy View is open you can press Ctrl+T to switch between Full type and Supertype hierarchy.
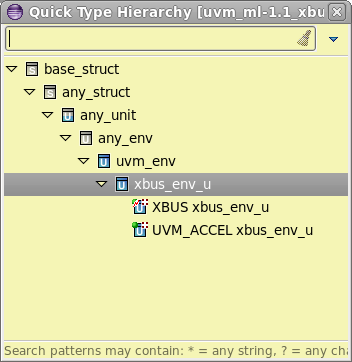
For methods you can also see the implementations along the hierarchy (icons are not grayed).
UVM Browser View
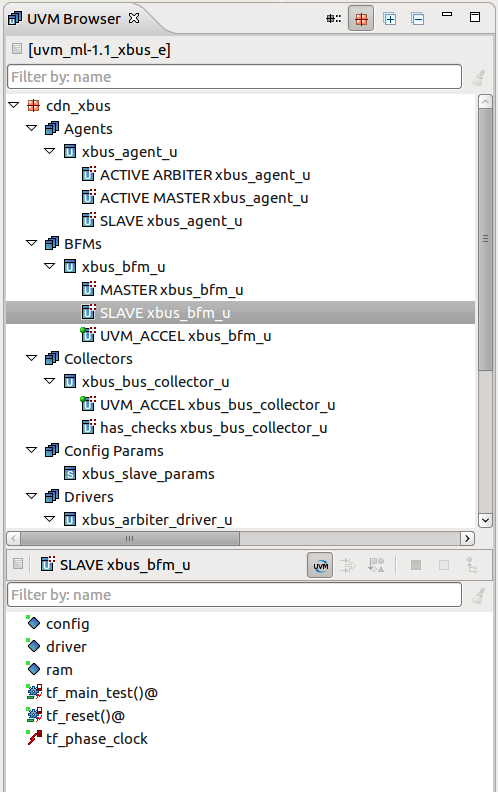
The UVM Browser View is an intuitive entry point for exploring the components of a UVM-based or eRM-based verification environment.
It allows you to explore UVM-based types grouped by categories, like agents, monitors, BFMs, drivers or sequences and easily inspect the UVM flow specific API, like sub-instances, overridden phases or TLM ports.
Open the view from menu .
You can use CamelCase or Simple Regex to locate a specific element.
Toolbar |
||

|
Prepend Package Name |
Prepend the enclosing package name to the name of each element, useful when you explore for example all agents across packages. |

|
Group By Package |
Group categories by package. You may chose to see for example all agents across packages or to explore all categories in a specific package. |
The top panel presents all the UVM-based structs and units defined in your verification environment. For convenience they are grouped by categories like agents or monitors.
The inheritance hierarchy between elements is shown up to the UVM base type and down to when subtypes.
The categories and their corresponding base types are the following:
Category |
Base type |
Methodology |
Agents |
uvm_agent |
UVM e |
Agent Configs |
uvm_agent_config |
UVM e |
BFMs |
uvm_bfm |
UVM e |
Collectors |
uvm_collector |
UVM e |
Config Params |
uvm_config_params |
UVM e |
Drivers |
any_sequence_driver |
eRM |
Envs |
any_env / uvm_env |
eRM / UVM e |
Env Configs |
uvm_env_config |
UVM e |
Items |
any_sequence_item |
eRM |
Memories |
vr_ad_mem |
vr_ad |
Monitors |
uvm_monitor |
UVM e |
Ports |
any_port |
eRM |
Registers |
vr_ad_reg |
vr_ad |
Register Files |
vr_ad_reg_file |
vr_ad |
Register Maps |
vr_ad_map |
vr_ad |
Scoreboards |
uvm_scoreboard |
UVM e |
Sequences |
any_sequence |
eRM |
Signal Maps |
uvm_signal_map |
UVM e |
Virtual Drivers |
any_sequence_driver (of a virtual sequence) |
eRM |
Virtual Sequences |
any_sequence (no item) |
eRM |
Phases |
tf_phase_t |
UVM e |
Phase domains |
tf_domain_t |
UVM e |
The bottom Members Panel panel displays members of the type selected in the top panel. You can toggle the UVM Members Mode on/off using the  button.
In UVM Members Mode it displays the following members:
All unit instances
Fields whose type is or inherits from one of the base types defined in the table above
Fields whose type is or inherits from a type defined in the uvm_e, uvm_scbd and vr_ad libraries
Fields whose type is or inherits from uvm_accel_input_pipe_proxy or uvm_accel_output_pipe_proxy
Extensions of fields, events and methods introduced by calls to macros defined in the uvm_e, uvm_scbd and vr_ad libraries
Extensions of UVM Scoreboard Data Transformation methods
Extensions of UVM Scoreboard Match Process Customization methods
Extensions of e Language Phases and Predefined Methods, like run(), connnect_pointers(), pre and post_generate() etc.
Extensions of body(), pre_body() and post_body() methods of any_sequence
When the UVM Members Mode is off, the Members Panel behaves exactly like the Members Panel of the Type Hierarchy View.
UVM Sequence Tree View
The UVM Sequence Tree View presents the call tree of a sequence.
Place the editor cursor on a sequence, right click and choose or press Ctrl+Alt+Shift+S.
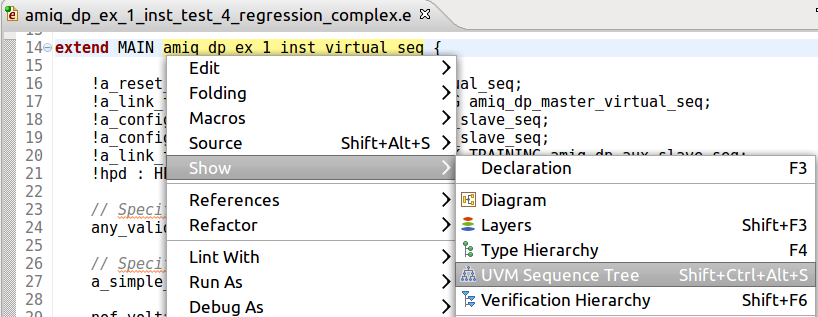
The view is automatically raised and populated with the call tree of the selected sequence.
The call tree is made of all sub-sequences that are triggered by the selected sequence, in order, recursively down to leaf items.
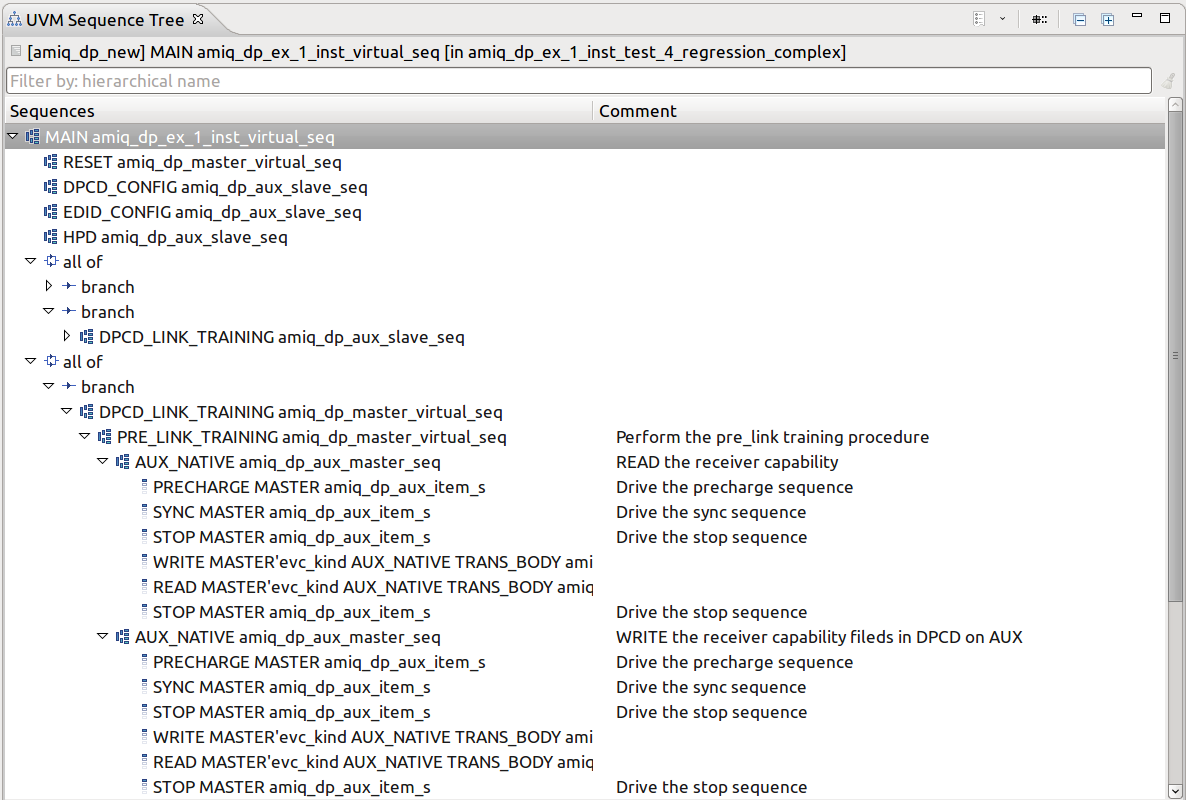
The pre_body(), body() and post_body() methods of each sequence are analyzed, along with all TCMs called directly or indirectly from any of these methods.
Note
All relevant layers (extensions) of each TCM are analyzed according to their type (is also, is first, is only). A TCM layer is relevant if it belongs to a struct layer whose determinant is the same or included by the determinant of the sequence layer where the view was called.
Note
Only the modules loaded up to and including the module where the view is triggered are analyzed. For example, when triggered from a particular test, sequence calls in other tests are not analyzed. See also how DVT handles e Language Test Files and the Compile Order view.
Note
all of, first of and start actions are also shown.
Note
A sub-sequence may be called using a do action or started using the seq.start_sequence() function.
Tip
Double click on any node to jump to the sequence call.
Tip
Right-click on a sequence node to Show UVM Sequence Tree of the selected sequence. Practically set the selected sequence as root.

|
Show History List |
Click to see the previously inspected sequence call trees. |
|---|---|---|

|
Prepend Package Name |
Prepend the enclosing package name to the name of each class. |

|
Sequence. |
|---|---|

|
Sequence item. |

|
All of/first of block. |

|
All of/first of branch, or start action. |
Verification Hierarchy View
The Verification Hierarchy View presents the unit instance tree.
Position the editor cursor on the name of a unit and press Shift+F6 or right-click and choose from the context menu.
The Verification Hierarchy View opens with the chosen unit set as the top of the hierarchy. You can also go to to open the view.
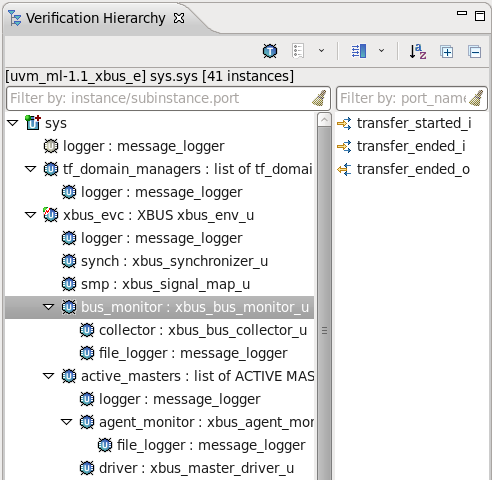
 Select Top drop-down menu/pop-up dialog to select from top units. By default, tops are considered all units that instantiate other units and are not themselves instantiated, such as the unit sys. You can specify the list of tops in the project’s build configuration using the directive +dvt_e_vtop+”pkg_name::SUBTYPE unit_name”.
 History List Click to see the previously inspected tops.
 Show/Hide Ports Shows or hides the ports of the selected unit. You can set the ports panel to the right or below the hierarchy.
 Alphabetical Sort Sort instances and ports alphabetically. By default it is off, which means that the instances and the ports are presented in their declaration order from the source files.
The view label shows the current project, the current top unit and the number of instances in the hierarchy.
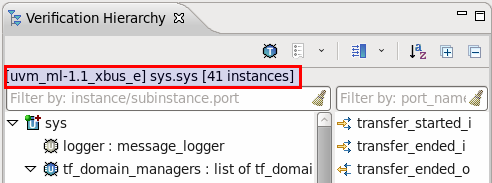
You can double-click on any unit or on any port to go to its declaration.
Right-click on a unit instance in the hierarchy and you have the following options :
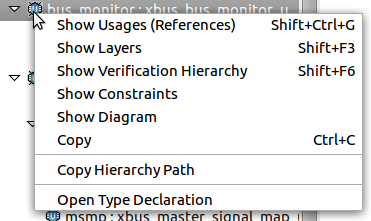
Show Usages (References) Search for the references of the selected instance. More details Search for References (Usages, Readers or Writers)
Show Layers Show the layers of the selected instance. More details Layers View.
Show Type Hierarchy Show the type hierarchy for the selected instance type. More details Type Hierarchy View.
Show Verification Hierarchy Set the selected instance as the top of the hierarchy and update the view.
Show Diagram Generate the UVM Component Diagram of the selected instance. More details UVM Components Diagrams.
Copy Copy the label text of the selected instance to clipboard.
Copy Hierarchy Path Copy the hierarchy path of the selected instance to clipboard. You can change the segment separator from .
Open Type Declaration Go to the unit declaration of the selected instance.
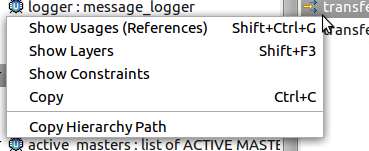
Right-click on a port and you have the option to search for its usages or for its layers and show the constraints, also you can copy its name and the full hierarchy path of the selected port.
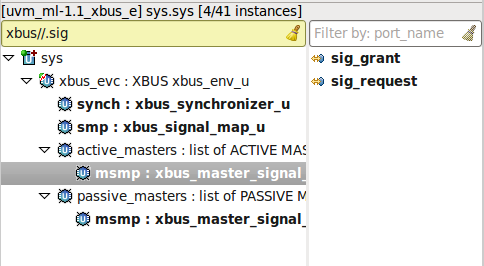
You can use the filters to locate a specific instance or port. You may use slash ‘/’ characters to filter hierarchically one level and ‘//’ to filter hierarchically all the levels. You may use the dot ‘.’ character to filter instances that contain a specific port. See Quick Search in Views for more details.
For example, filtering hierarchically all the levels for a specific port name :
