Breakpoints
When you launch a debug session or connect to an existing one, you have the option to use the Eclipse breakpoints, the Simulator breakpoints or merge them.
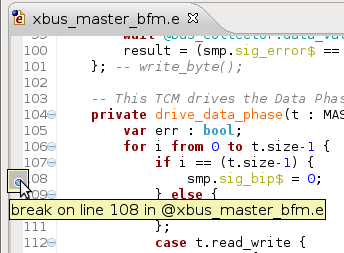
Double-click in the Editor to Add/Remove a Breakpoint
You can double-click on the vertical left bar of the editor to add/remove a breakpoint.
The Breakpoints View
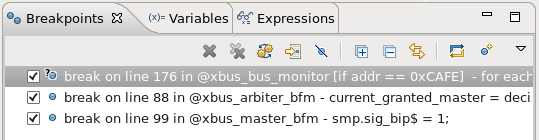
Double click on a breakpoint to go to source file.
Check/uncheck a breakpoint to enable/disable.
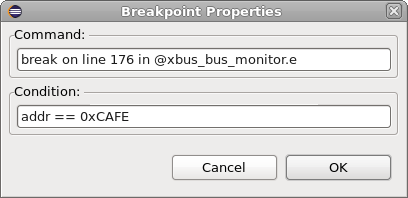
Right-click to see breakpoint properties and change them.
A number of convenient actions are available in the Breakpoints View toolbar:

|
Show source file |
|---|---|

|
Disable all breakpoints |

|
Add new breakpoint |

|
Synchronize breakpoints - in case you have discrepancies between DVT breakpoints and the simulator |

|
Remove breakpoint |

|
Remove all breakpoints |
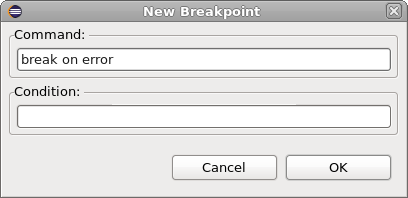
New Breakpoint (e Language Only)
Click on the Add new breakpoint button to create a custom breakpoint: you can use any legal breakpoint command.