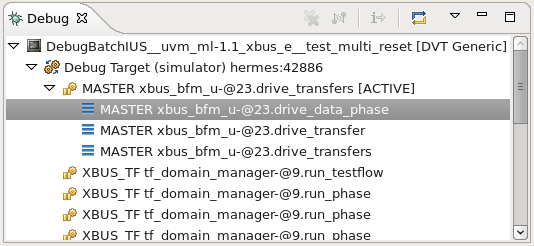
Threads, Call Stack, Stepping
From the Debug View you can:
See all the threads and the call stack of the current thread.
Switch to another thread: right click > Set Thread Active (e Language Only).
Move up and down in the call stack. The Variables View is automatically updated and presents the variables in the current frame (function/task/process/method/tcm). The Editor always highlights and indicates the currently executed line.
The buttons in the Debug section of the toolbar allow you to:
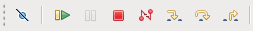
Skip all breakpoints
Resume (continue) a stopped simulation
Suspend (stop in debugger) a running simulation
Terminate a simulation, if launched by means of a DVT Generic Debug Configuration
Disconnect from a simulation
Step into, step over, step out (step return)