Tooltips
A tooltip is a brief, informative message that appears when a user interacts with an element in a graphical user interface (GUI). In DVT tooltips are initiated through a mouse-hover gesture. Tooltips can be triggered from the following areas:
Code
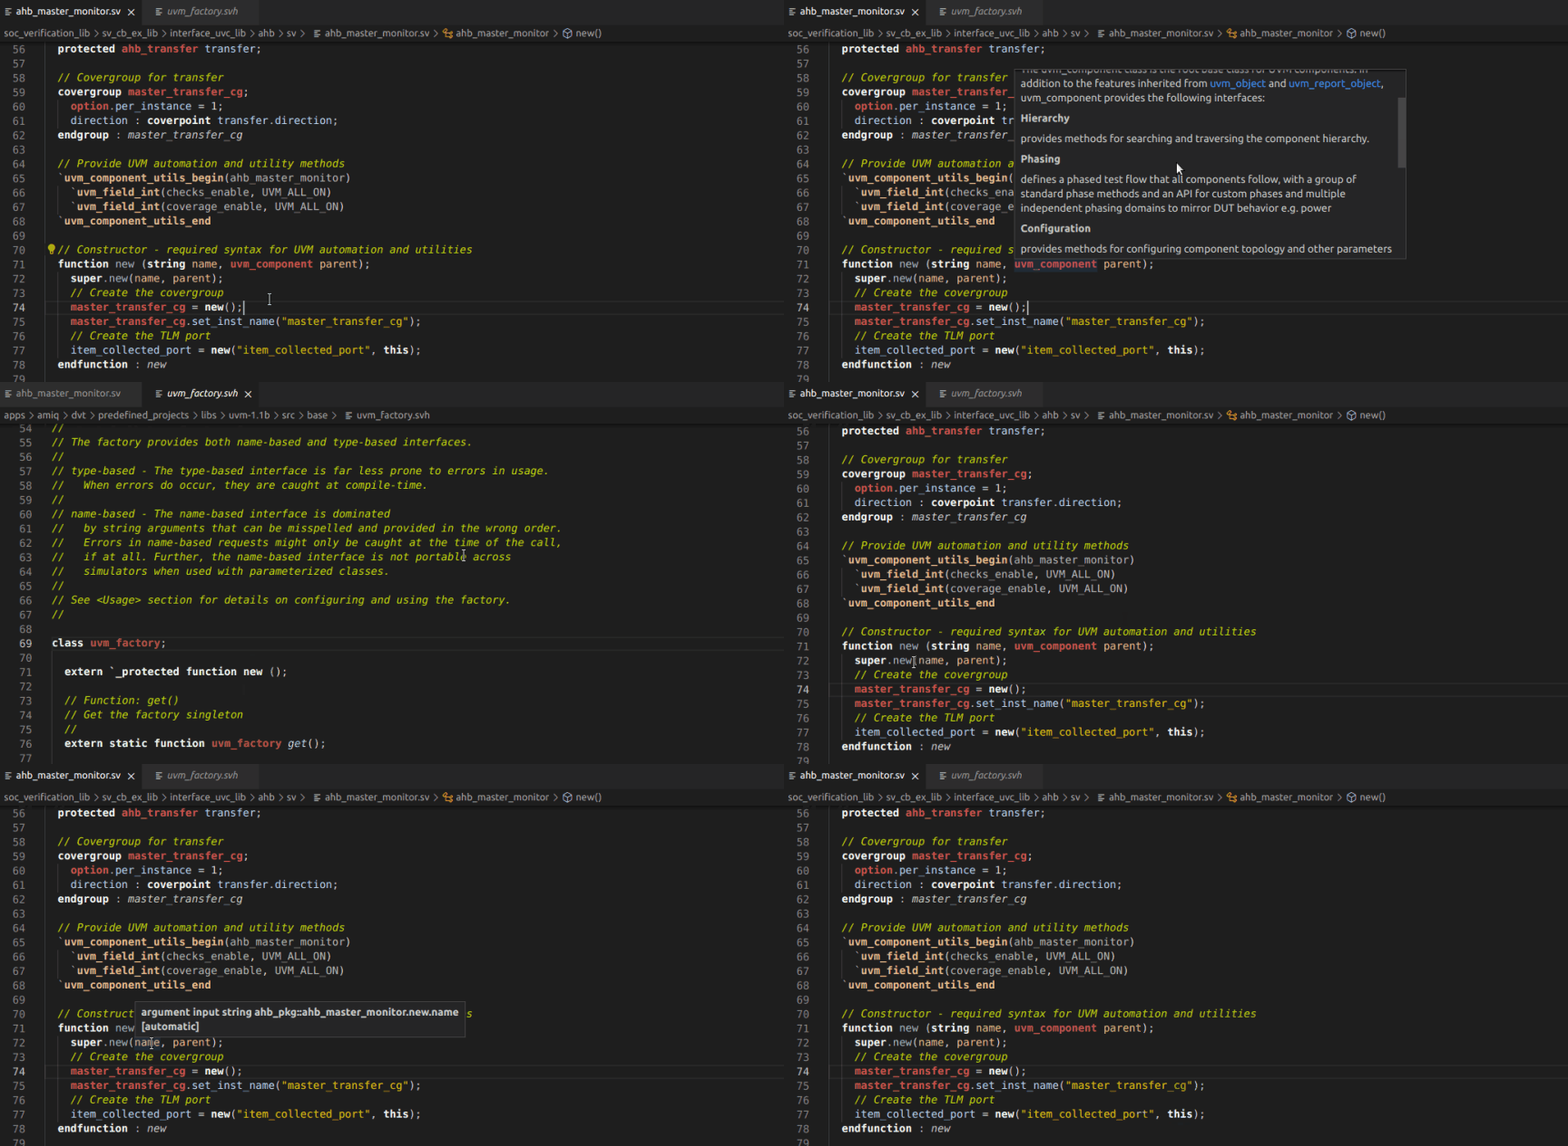
Place the mouse cursor over an identifier in the editor. Tooltips are available for all the types, methods, fields, macros, etc. from the source code files that DVT analyzes in your project.
The tooltip will display information about the element under the cursor including the comment associated with the element’s declaration (written above or inline), or the LRM documentation for predefined API, the scoping information for types (enclosing package), the full signature of methods and the direction of ports.

Problems
Place the mouse cursor over the problem highlighted range (squiggle underline).
The tooltip will display the error or warning message.
WaveDrom Diagrams
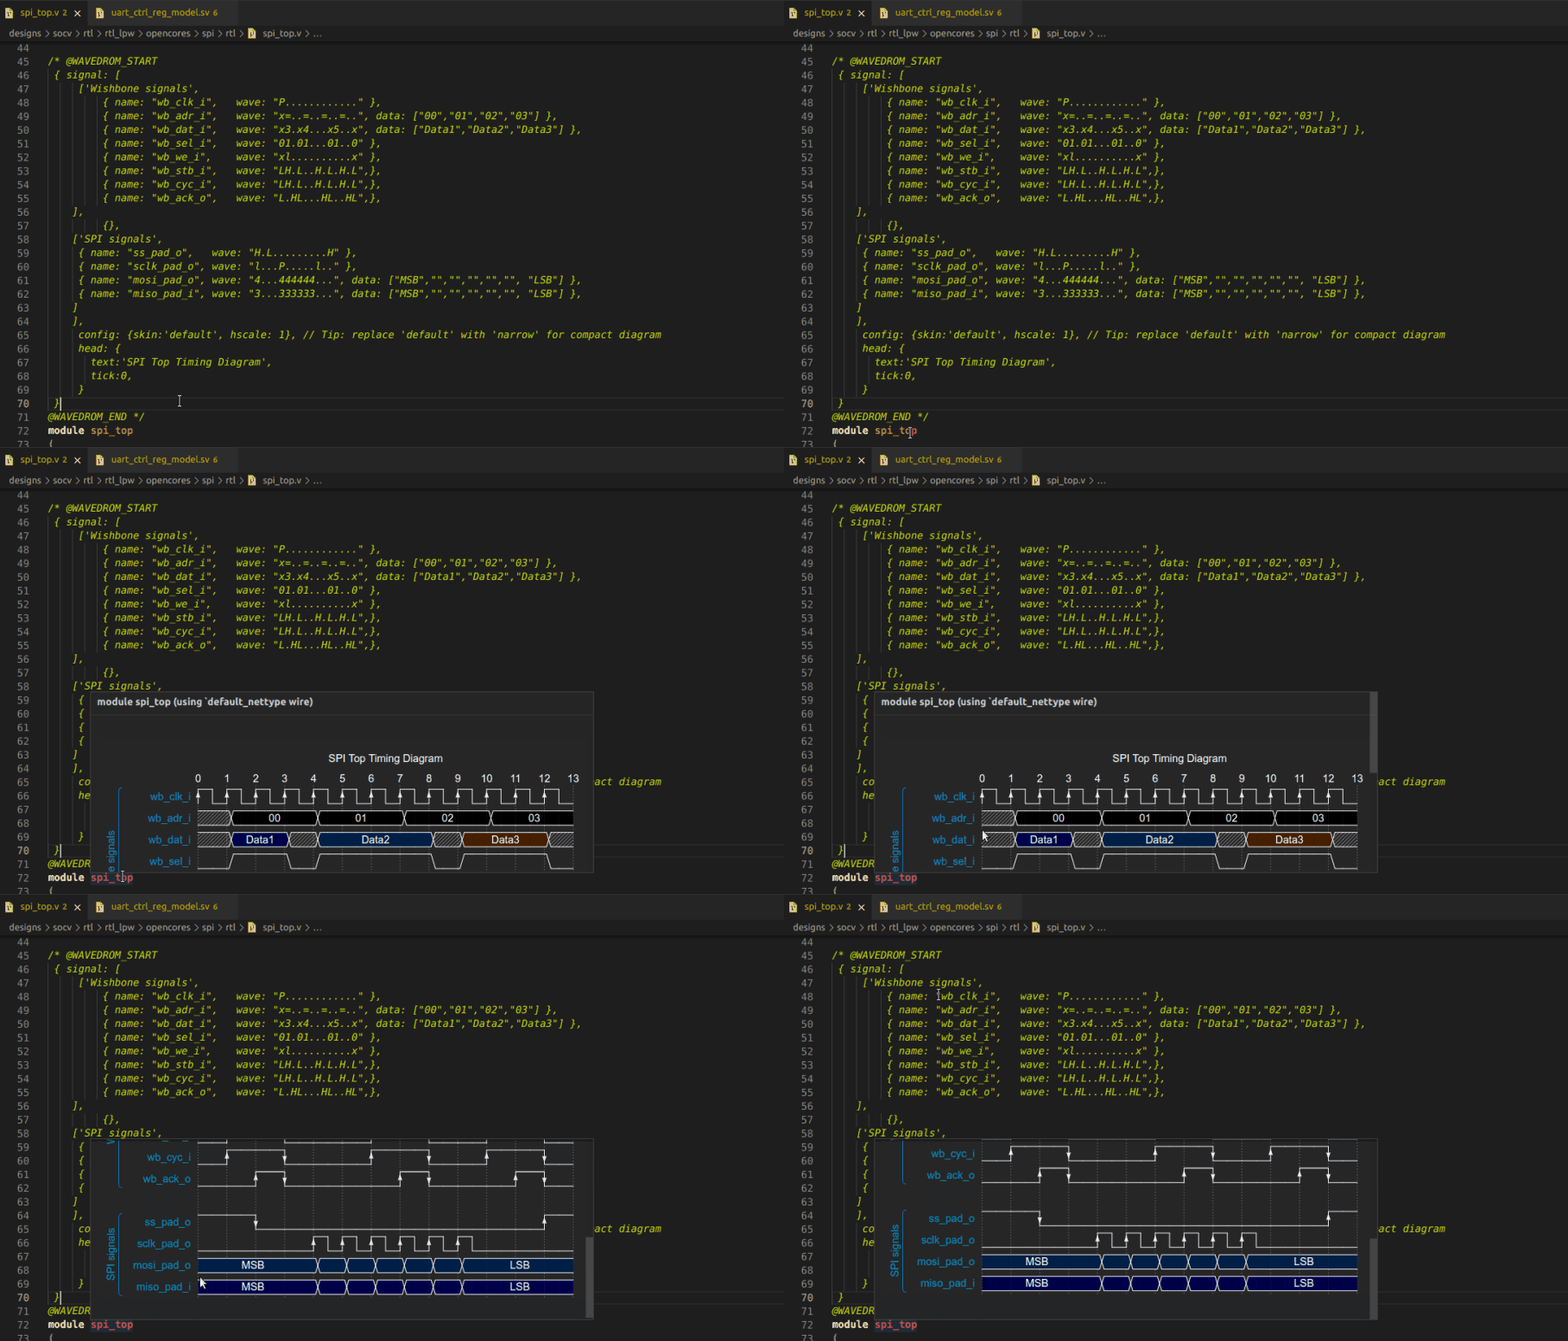
Place the mouse cursor over a JSON waveform description written inside a comment.
The tooltip will display WaveDrom Timing Diagrams, if the descriptions are compliant with the WaveDrom library standard.

Macros Values
Parameter Values
Override indications
Place the mouse cursor over the method name.
The tooltip will display the overridden method signature.
UVM Register Bit Field Diagrams
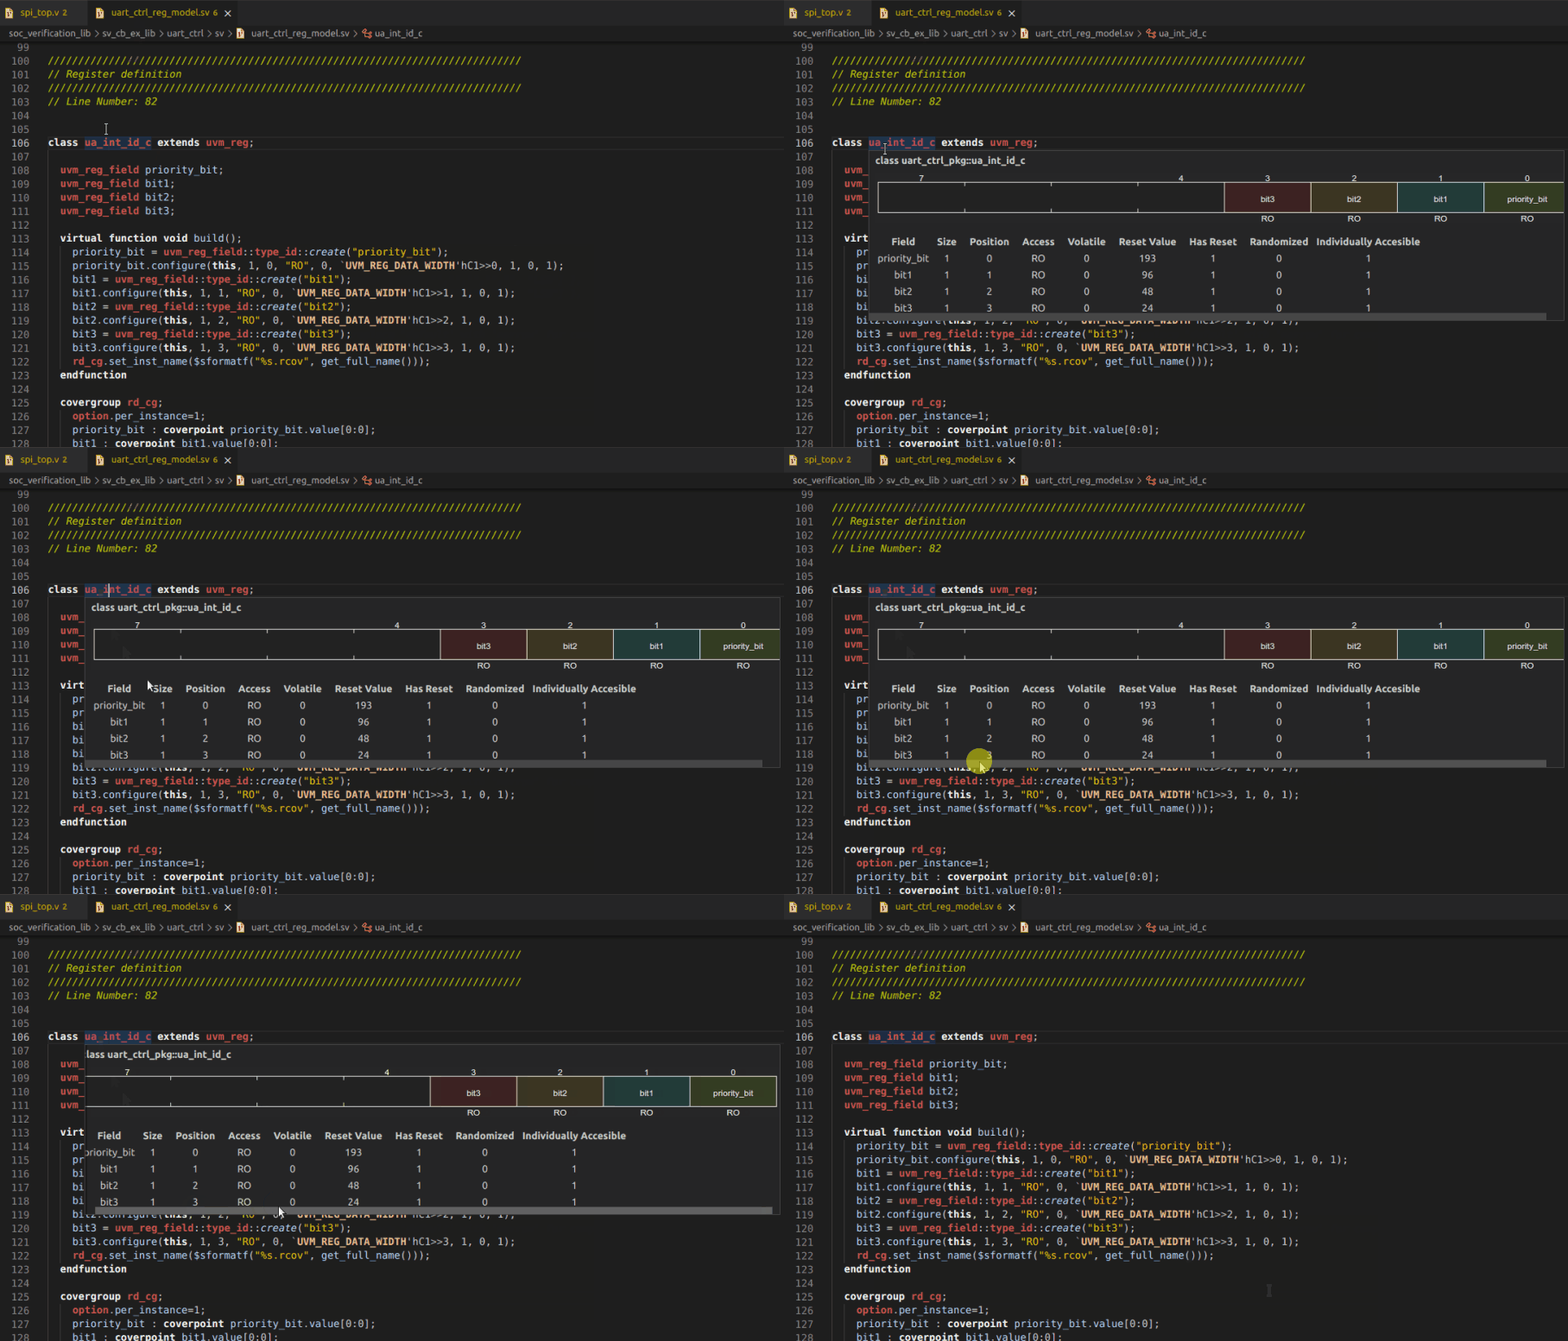
Place the mouse cursor over an UVM register class.
The tooltip will display Bit Field Diagrams for UVM registers, by parsing the UVM configuration methods.

Method Call Arguments Mapping, Macro Call Arguments Mapping, Ordered Parameter Mapping or Ordered Port Connection Mapping
Place the editor cursor on a method call argument and use the Trigger Parameter Hints command.
The tooltip will list all the method declaration arguments along with their name, type, direction, and default value. Move the editor cursor to inspect argument mapping - the argument under the cursor is always highlighted.
The same functionality is available for macro calls, instance parameter connections and instance port connections.
