UVM Runtime Elaboration
By performing the runtime elaboration of a UVM test, you can view testbench structures accurately reflecting the configuration at start of simulation.
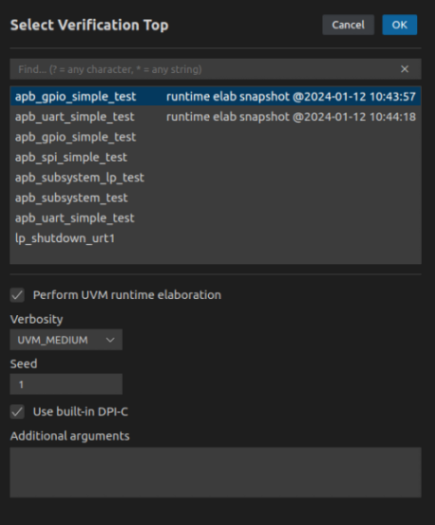
Open the Command Palette and invoke the DVT: Select Verification Hierarchy Top command.
Pick a test and check Perform UVM runtime elaboration.
Alternatively, press the  button in the Verification Hierarchy view header. Any runtime elaboration of a test is automatically saved and you can later select it as a Verification Top.
The output of the UVM elaboration is printed in the Debug Console.
Click on the left vertical bar to add / remove a breakpoint. If you set any breakpoint in the source code, you are prompted to switch to the Run & Debug View. Elaboration suspends whenever a breakpoint is reached.
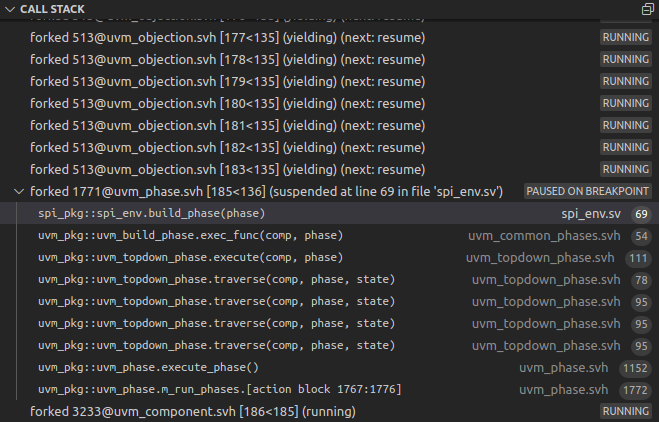
The Call Stack View presents all the threads and the current call stack.
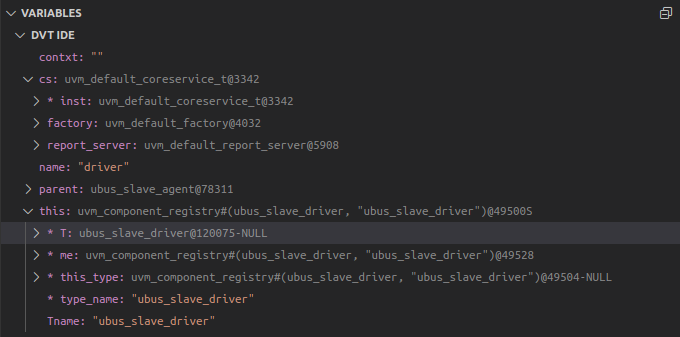
The Variables View presents variable values in the current scope.
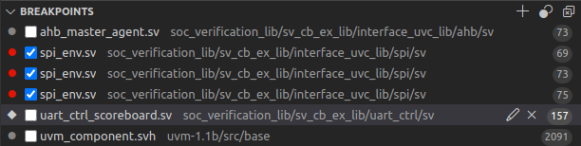
The Breakpoints View presents all the breakpoints and their enablement state.
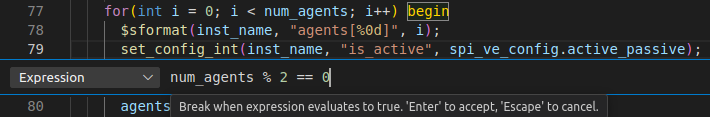
You can add Conditional breakpoints to suspend execution only when a specific condition is met. Right click on the left vertical bar and select Add Conditional Breakpoint….
You can further configure other attributes by right clicking on an existing breakpoint and selecting Breakpoint Properties….
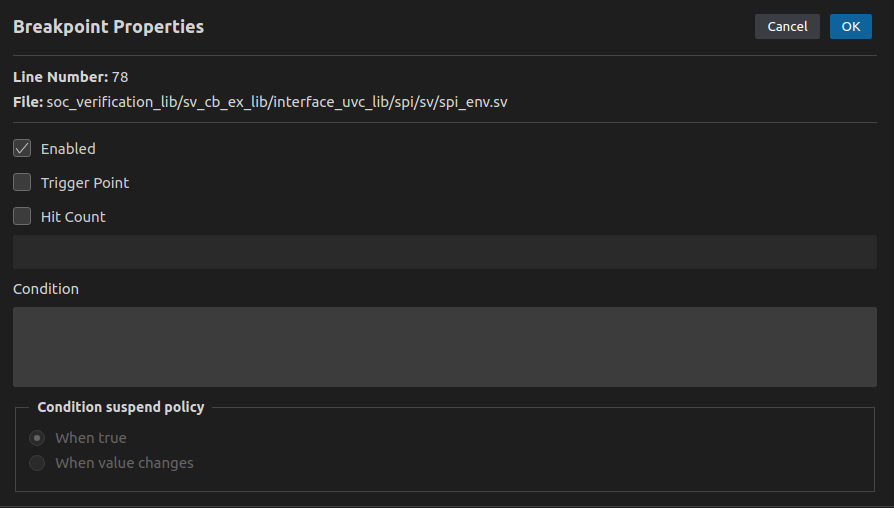
Enable Trigger Point to use the selected breakpoint as a trigger point. All the other breakpoints are enabled only after any of the trigger points has been hit.
Set a Hit Count value to suspend the execution only when the breakpoint is encountered for the hit_count time
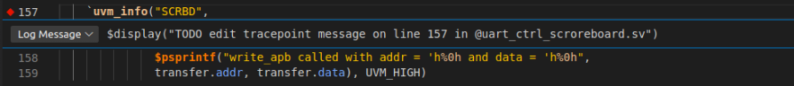
You can also add printouts without altering the source code by using logpoints. Right click on the left vertical bar and select Add Logpoint…. You can use only a $display() statement in the editable textbox below the breakpoints list, however its arguments may call other functions.
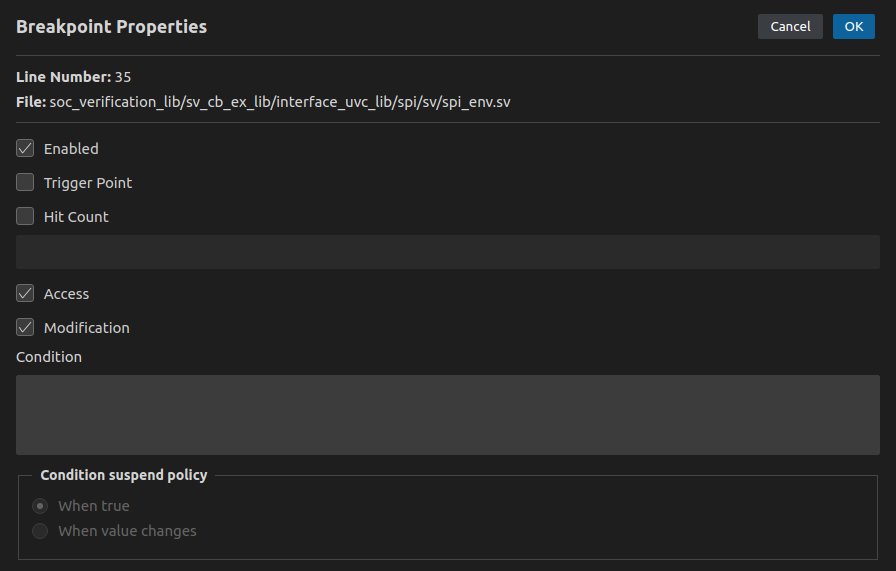
Watchpoints tell you exactly what line of code causes a variable to change. You can add a watchpoint by clicking on the editor vertical bar next to a global variable declaration or a method argument.
By default, execution is suspended whenever the value of the given variable is accessed or modified. You can choose when to stop execution by configuring the Access/Modification checkboxes in Breakpoint Properties.
C/C++ Interface Handling
The UVM runtime elaboration involves DPI-C method calls. DVT has a built-in library of UVM DPI-C implementations. To use it simply check the corresponding box in the verification top selection dialog.
If user-defined C/C++ functions or system tasks are involved in the elaboration, there are two options:
all C/C++ top files declared in Build Configurations will be compiled into shared objects which will be automatically added at runtime
additional shared objects can be specified in the Additional arguments textarea using the standard - sv_lib, - sv_liblist and - sv_root flags, for example: -sv_lib /path/to/lib.so
From the Command Palette invoke the DVT: Generate DPI-C Headers command to generate the DPI-C header stubs command required for the C compilation. Header files are created in the dvt.data/native.bridge/headers directory located in the project root.
C/C++ compilation
C/C++ top files specified in build configuration file are compiled into shared objects, one shared object per invocation
compilation is done using a Makefile generated from the build config located at: dvt.data/native.bridge/bin/Makefile
compiled shared objects are stored inside: dvt.data/native.bridge/bin/objs. At runtime all shared objects located in this directory will be loaded
C/C++ flags collected at build are added to the Makefile
Troubleshooting
This section covers several debugging directives you can use if you encounter issues when working with DPI-C methods:
+dvtx_native_verbosity |
The UVM Runtime Elaboration displays the name of the executed import/export DPI-C methods in the Console. |
|---|---|
+dvtx_native_trace |
The UVM Runtime Elaboration logs debug information as part of the C/C++ native evaluation. |
+dvtx_native_no_gen |
Provides the ability to edit the automatically generated C/C++ stubs and Makefile used for compilation. |
+dvtx_native_jimpl_uvm |
Use the built-in library of UVM DPI-C implementations. |
+dvtx_disable_native_compilation |
Disables the compilation of C/C++ top files. |
Note
If you need any of these directives, you need to add them in the Additional arguments text area.
- At any time, you can set a system variable in the build configuration file to change the location of dvt.data as follows:
+dvt_setenv+DVT_DATA=/path/to/dvt/data