How to Report an Issue?
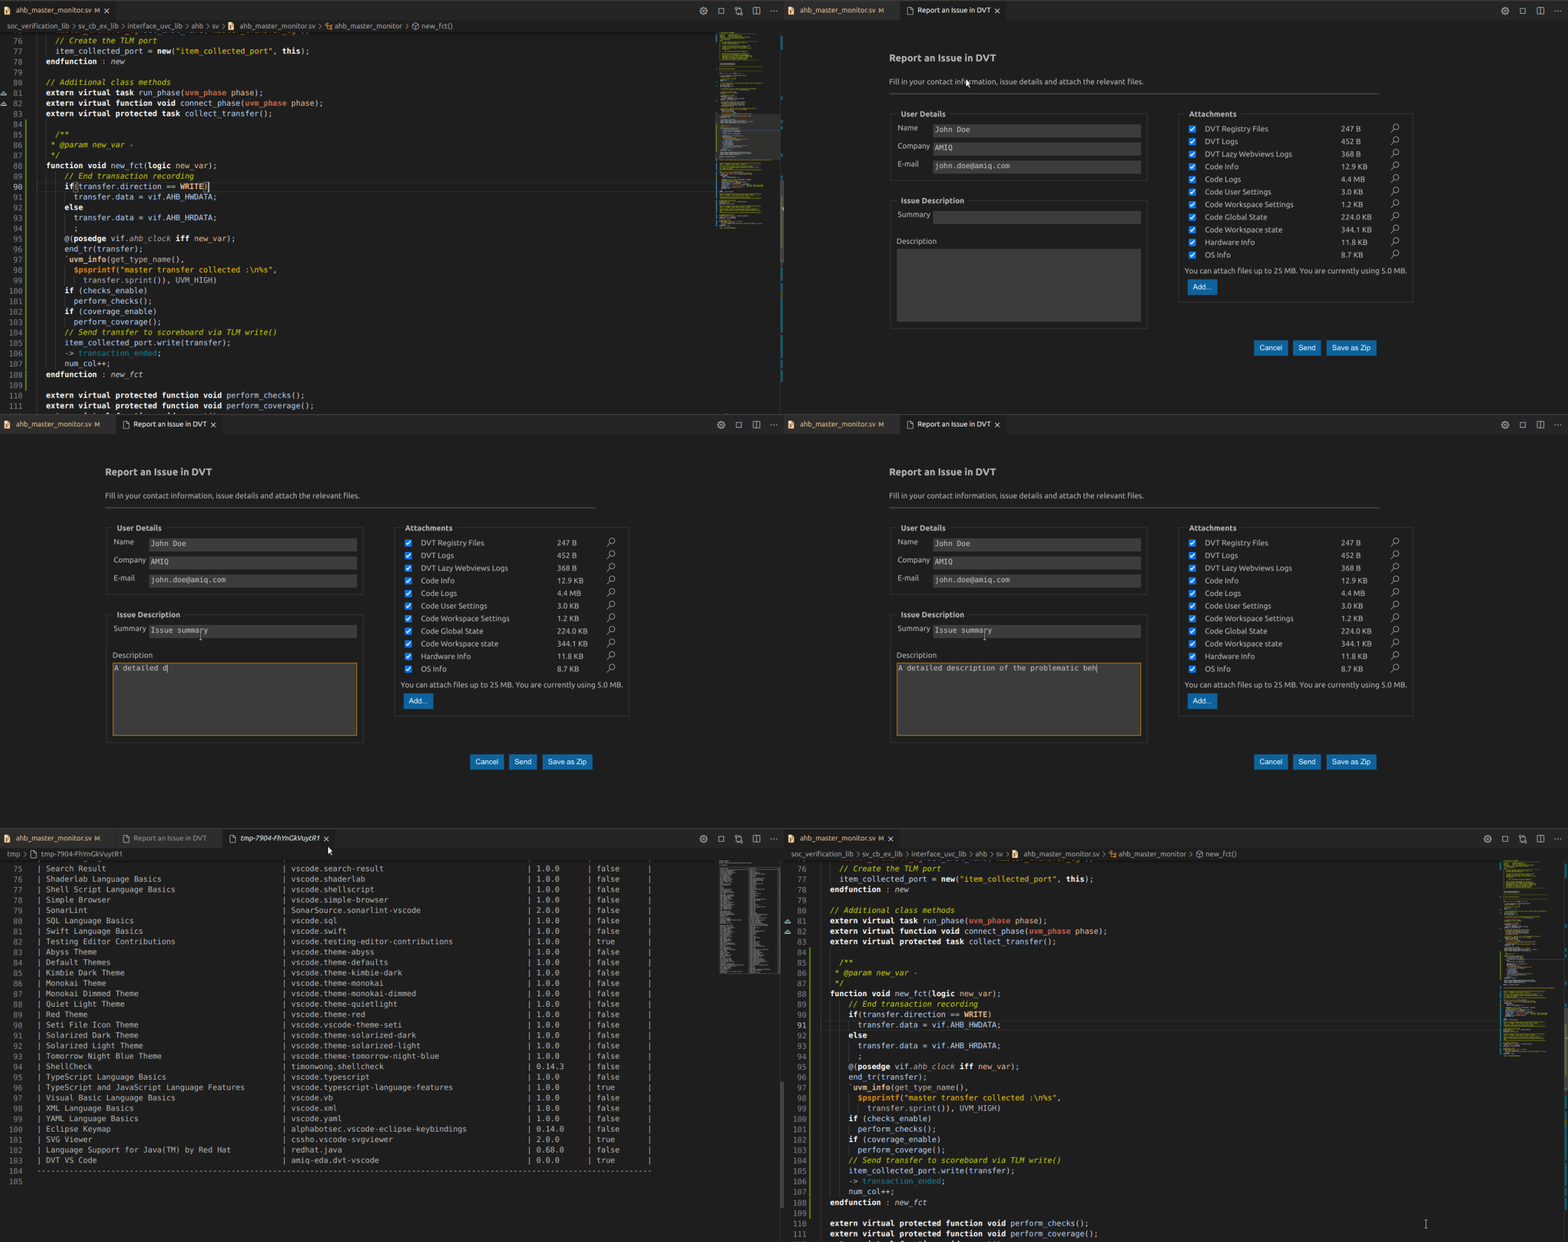
You can send an issue report using the DVT: Report an Issue command. Along with a problem description, we often need logs and system information in order to reproduce a problematic behavior and fix it.
Fill in the identification data (will be remembered for future reports) and issue description.
Attach screenshots, code snippets or any other files you consider helpful in reproducing the problem.
Note
By default various application logs and diagnostic files are attached.
You can preview any attachment using the magnifier icon.
When you click Send, an e-mail is sent to support@amiq.com with your own address in CC.
You can also save the issue report as a zip archive, and send it manually to support@amiq.com (for example if you don’t have Internet connectivity on the machine where DVT runs).
The most useful debug information when dealing with performance issues is a JVM thread dump. Most likely this will help us pinpoint the problem and provide a fast solution.

How to generate a thread dump from within DVT for VS Code?
To generate a thread dump from within DVT for VS Code use the DVT: Start Thread Dump Collector command. Perform the operation that causes the performance issue and afterwards stop the process using the DVT: Stop Thread Dump Collector command.
The thread dump is generated at $HOME/.dvt/ls/logs/profiling.
Note
The DVT: Start Thread Dump Collector / DVT: Stop Thread Dump Collector commands can be invoked also by using the buttons from the Diagnostics View toolbar.