DVT IDE for VS Code User Interface
VS Code allows extensions to contribute to its user interface through various means such as providing views in the Side Bar or Panel areas, decorate the Editor, and add additional information in the Status Bar.
The DVT IDE for VS Code contributes to all of the five main User Interface areas.
Editor
The DVT IDE for VS Code contributes to the Editor Area through various means such as:
File Decorations
Code Folding
Code Lens
All these functionalities, among others, help increase the productivity while working in the Editor.
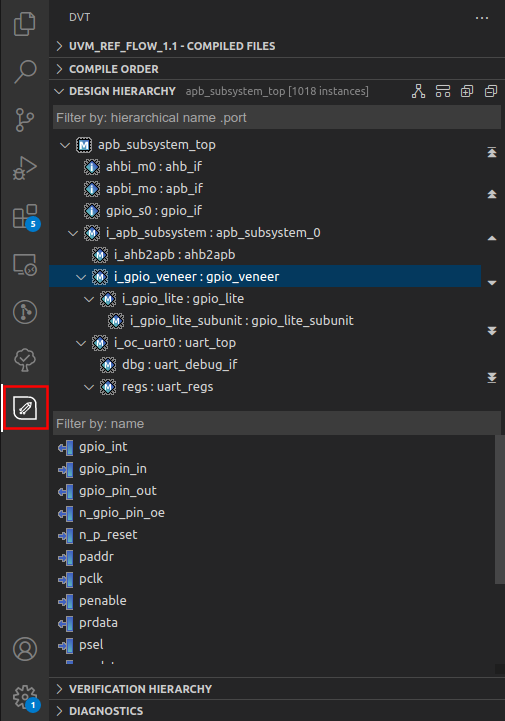
DVT Activity Bar
The DVT IDE for VS Code provides an entry to the Activity Bar that will toggle on/off the DVT Side Bar.

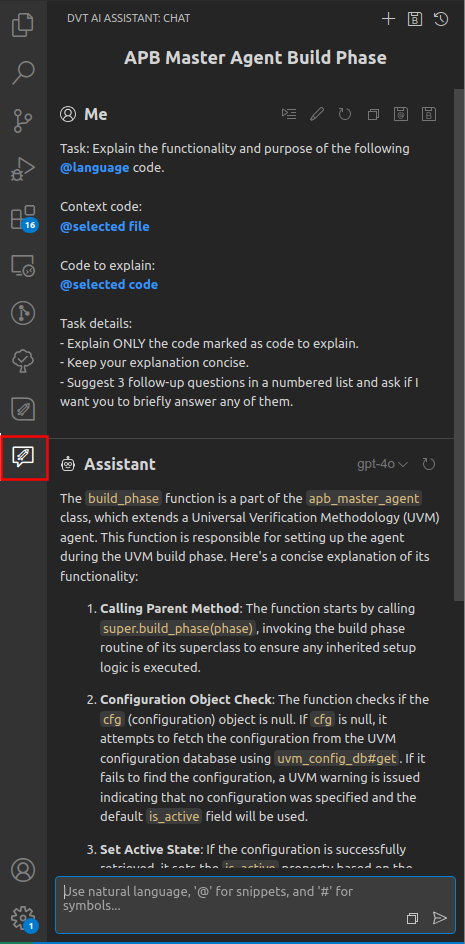
DVT AI Assistant Activity Bar
The DVT IDE for VS Code provides an entry to the Activity Bar that will toggle on/off the DVT AI Assistant Side Bar.

Side Bar
The DVT IDE for VS Code contributes to the following Side Bar views:
Explorer Activity - Outline View
- Run and Debug Activity - available only when using the UVM Runtime Elaboration
- DVT AI Assistant Activity
Status Bar
A Status Bar item is a flexible contribution point that allows to display text, icons and also run a command upon clicking one. The following items are contributed by DVT:
Content Filters Item
Toggles on/off the Content Filters. For more information, see the Content Filters chapter in the documentation.

Request Processing Item
Displays a loading icon when the current Language Server is actively processing a request.

Memory Monitor Item
Warns when the operation in progress is significantly slowed down by low memory or a memory starvation. For more information, see the Memory Monitor chapter in the documentation.

Database out of Sync Item
Warns when the Language Server database is out of sync and requires user attention. For more information, see the Database Out of Sync Notification chapter in the documentation.

Heap Indicator Item
Displays the heap status of the current Language Server. This item can be enabled/disabled by using the DVT.languageServer.showHeapStatus setting.

Verissimo Item
Informs that a Verissimo session was started. Upon clicking, it opens the Verissimo menu.

Default Language Model Item
Displays the current default language model used for upcoming AI Assistant sessions. Upon clicking, it opens a picker that allows to select another language model as default.

Active Build Configuration Item
Displays the current in use build configuration file. Upon clicking, it opens a picker that allows to select another build configuration file. For more information, see the Build Configurations chapter in the documentation.

License Status Item
Displays information about the current state of the license upon hovering. For more information, see the License chapter in the documentation.

Panel
The DVT IDE for VS Code contributes information to both the Problems and the Output Panels. Moreover, when using the UVM Runtime Elaboration, 3 distinct views will be displayed in the Panel area.
Problems
In the Problems View DVT contributes with both compilation and Verissimo compliance errors or warnings.
Output
Regarding the Output Panel, DVT provides the following Output Channels:
[dvt] Build - Displays information related to the DVT compilation, such as path and compilation time for each file, problems summary and compilation statistics.
[dvt] Client - Displays information related to the VS Code client, such as language server management information and pop-up messages.
[dvt] License - Displays information related to the license client and server.
[dvt] Server - Displays information related to the current in-use Language Server, such as debug information and stack traces.
[dvt] Trace & [dvt] Trace Debug Adapter - Displays information exchanged between the VS Code client and the Language Server. By default, these output channels are disabled. To enable them, use the
DVT.trace.serverandDVT.trace.serversettings.[dvt] AI - Displays information related to the AI Assistant, such as debug information, errors and warnings.
[dvt] AI - Messages - Displays language model communication details, including messages sent to and received from them in plain text format.
