Log Viewer
Overview
The DVT Log Viewer is a powerful tool for simulation log analysis. It identifies structured entries such as UVM messages within the log and extracts attributes, like the timestamp, file, line, UVM component, message ID and text.
You can search and filter by entry attributes using an intuitive Query language. The log content is presented by default in a compact format, with a dedicated timeline. You can easily hyperlink to source code by file/line or UVM component, cross-link with the Waveform Viewer by timestamp and expand entries to drill down into details.
Right click on any file in the Project Explorer, and from the context menu choose Open With ‣ Other … ‣ Log Viewer, or browse to any location on disk from the File ‣ Open file… menu.
Tip
You can directly open zipped logs such as *.log.gz
When you open a log file, an Indexing process is started in the background.
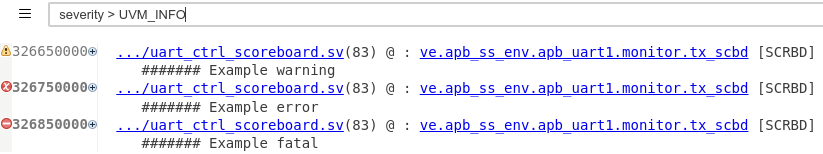
The annotation ruler displays icons for message severity: ![]() warning,
warning, ![]() error and
error and ![]() fatal
fatal
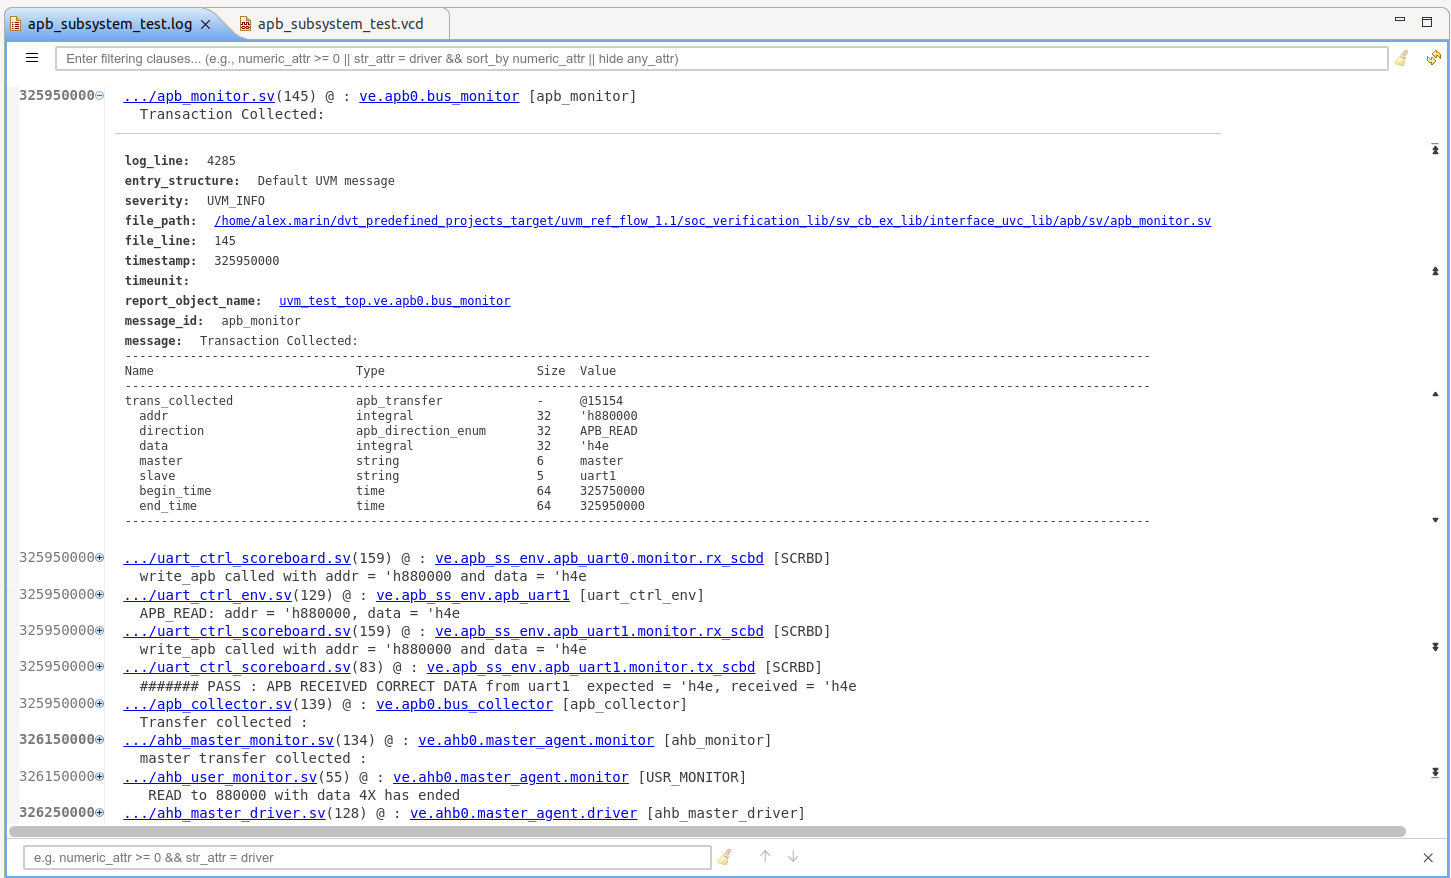
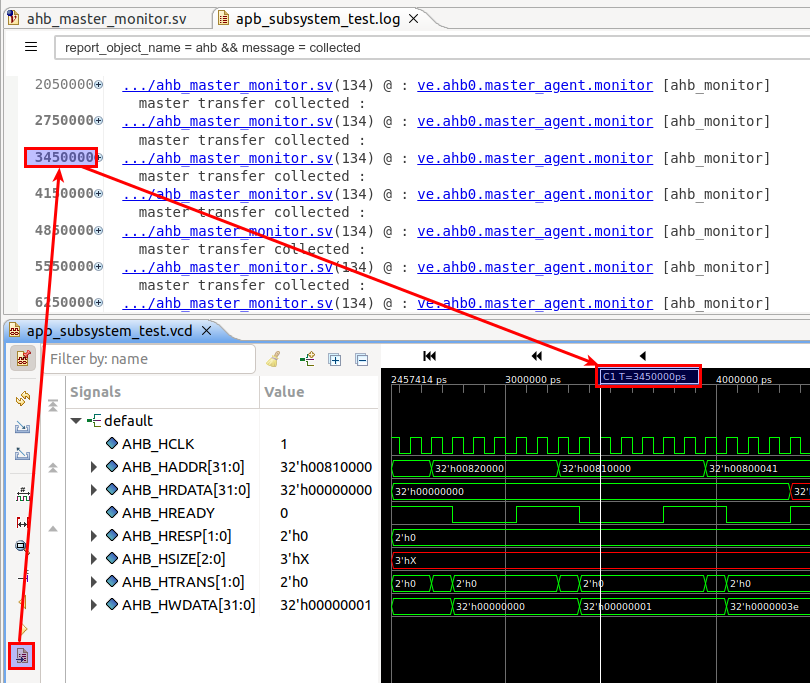
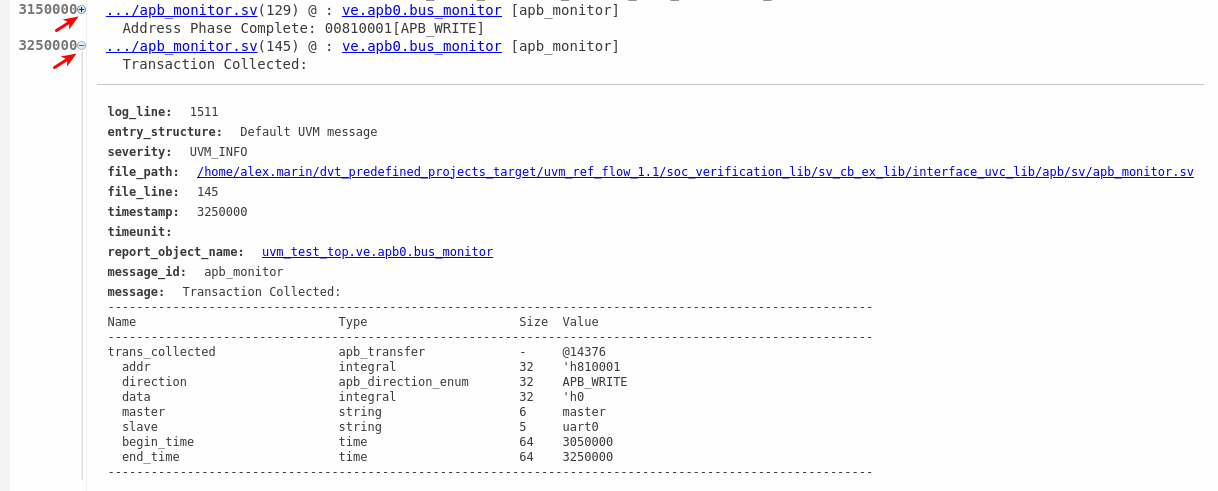
The timeline ruler presents message timestamps, highlighting changes so you can easily visualize groups of messages at the same timestamp. Double-click on a timestamp to reveal it in the current Waveform Viewer.
The viewer displays messages in a condensed format: filename, line,
UVM component (report_object_name) and message ID as well as the first line of the actual message text.
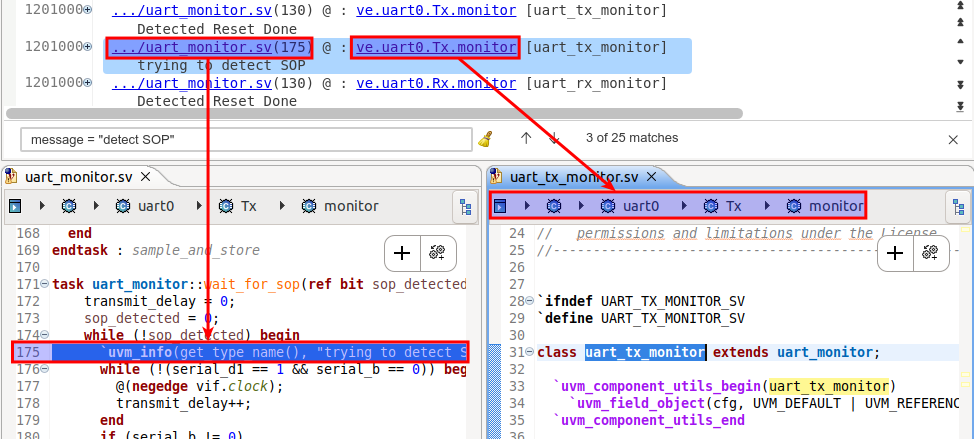
The filename link takes you to the source code line where the message was printed,
for example the `uvm_info() call. The UVM component link takes you to the definition of the UVM report object.
Tip
You can control whether the message text is condensed through .
You can expand the entries to inspect their structure, including the full message text.
- The scrollbar on the right side of the viewer allows to quickly navigate:
 to the top of the log: Ctrl+Home
 up one page: PageUp
 up one entry: ArrowUp
 down one entry: ArrowDown
 down one page: PageDown
 to the bottom of the log: Ctrl+End
Filtering and searching
You can type queries into the filter box at the top using a dedicated Query language. Press Enter to apply the filter.

Ctrl+F brings up the search box at the bottom of the viewer. Type the query and use the arrows to navigate across matches. Press Esc or click the close button to hide it.

Both filter and search input boxes provide content assist and input validation. Press Ctrl+Space to see available query keys and operators. Validation problems are clearly signaled, hover to get more information.
Message templates
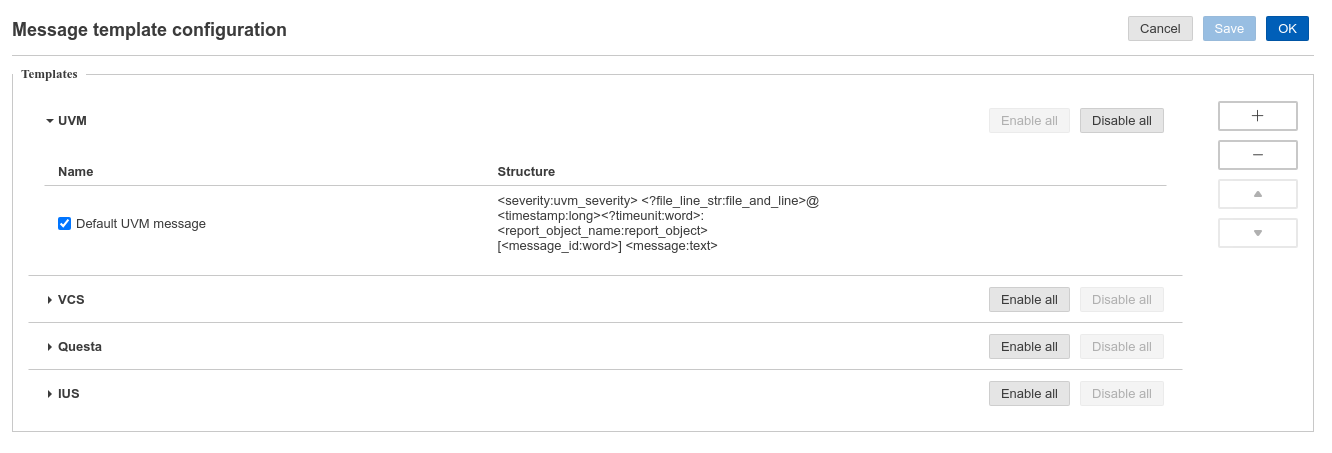
Each template has a category, name and a pattern which is matched against the log content. Every pattern match creates a structured entry, mapping attribute keys to their matched value. The Log Viewer has built-in templates for standard UVM messages and popular compiler and simulator messages. To select which ones are applicable for the current log, from the ☰ menu choose Configure message templates:
Note
Templates are applied in the specified order - the first one matching a chunk of log file content consumes it. You can move them up and down in the list using the arrow buttons. In case of templates with overlapping patterns, keep the more specific templates ahead of generic ones.
Note
By default, simulator-specific message templates are automatically enabled based on the log’s content. You can disable this behavior through . You can control the number of seconds after which the simulator detection times out through .
From this dialog you can also define new templates, for example if using a custom uvm_report_server.
Select a category, click the add button +, select Add structure, fill in the name and pattern, then click ✓.
Similarly, you can define a new category - click the add button +, select Add category, fill in the name, then click ✓.
Tip
Double-click on a template to edit its name or pattern.
Patterns are made up of plain text and attributes.
Attributes have the form <attribute_key:attribute_type> and match log content based on their type:
Attribute type |
Example usage |
Matches |
Example match |
file_path |
<filename:file_path> |
relative or absolute path |
/path/to/uvm/src/uvm_pkg.sv |
file_line |
<line_no:file_line> |
positive number |
3754 |
file_and_line |
<fileline:file_and_line> |
relative or absolute path followed by line number between brackets |
../env/usb/usb_monitor.sv (1234) |
int |
<error_code:int> |
integer numbers representable as standard ‘int’ format |
1234 |
long |
<timestamp:long> |
integer numbers representable as standard ‘long’ format |
12345678 |
report_object |
<comp:report_object> |
hierarchical path of a UVM component |
uvm_test_top.env.usb_agents[0].usb_monitor |
severity |
<sim_severity:severity> |
an enumerated set of values mapped to infos, warnings, errors |
Error |
uvm_severity |
<severity:uvm_severity> |
an enumerated set of values mapped to UVM severities |
UVM_FATAL |
text |
<message:text> |
any text including newlines numbers and symbols up to the next matching attribute |
APB_READ: addr = ‘h810000, data = ‘h55 |
word |
<timeunit:word> |
single word, any combination of upper- and lower-case letters, digits and underscores |
ps |
You can use any identifier for attribute keys. However the following have a special meaning:
Attribute keys:
timestamp |
matched values are shown on the timeline ruler |
report_object_name, message_id |
matched values are rendered as hyperlinks |
log_line, entry_structure |
reserved attribute keys |
Attribute types:
file_path, file_and_line |
matched values are rendered as hyperlinks |
severity, uvm_severity |
matched values are rendered as icons on the vertical ruler |
You can make an attribute optional by prefixing its name with a question mark, for example <?optional:text>.
Similarly, you can specify an optional character or plain text by using ?<char> or ?(<plain_text>).
Tip
Escape the ? , ( , ) characters to explicitly use them.
Query language
Queries are used for filtering and searching the log entries. In the query you can reference any attribute key from the applicable patterns. A query can be as simple as a single match clause, for example:
- message = “reset done”
matches entries where attribute key “message” has a value containing “reset done” text (case sensitive)
- timestamp = 1234567
matches entries where attribute key “timestamp” has a value of exactly 1234567
You can combine multiple match clauses using boolean operators, for example:
- message = “reset done” && timestamp > 1000
“reset done” messages after time 1000
You can combine clauses into complex queries using parentheses, for example:
- message = “reset done” && (timestamp < 1000 || timestamp > 123456)
“reset done” messages outside a interval
- message = “reset done” && (timestamp < 1000 || timestamp > 123456)
“reset done” messages outside a interval
- report_object_name = “uart0.master_agent.driver” && (message_id = “RX_ITEM” || message_id = “TX_ITEM”)
all log entries from UART0 master driver with specific UVM message IDs
Note
The entry_structure built-in attribute is set to the name of the pattern, and can be used to hide all unrecognized sections of the log using entry_structure != N/A
Note
Queries which don’t start with an attribute key will be applied on all the attributes.
Tip
Unrecognized sections can also be filtered using the  Filter unrecognized content button.
When used for filtering, the query can also include display modifiers:
Modifier |
Example |
Effect |
hide |
report_object_name = “uart0.master_agent.driver” && hide report_object_name |
hide report_object_name in the collapsed entry as all entries will show the same matched value |
sort_by |
entry_structure = “Retry pattern” && sort_by -nof_retries |
show only user defined entry structures called “Retry pattern” and sort descending by custom attribute nof_retries |
Indexing
When you open a log file, it is processed in the background. Log entries are identified and a search/filter index is built.
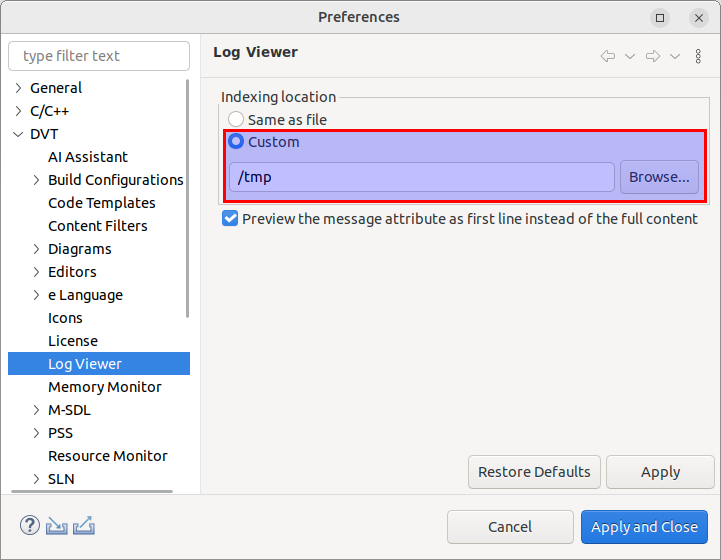
By default, the index is saved in a folder called .dvt.<log_name>.<log_path_hash>, in a temporary location.
You can customize the location of the indexing related files through .
Note
When the log is located in a read-only directory, the index is saved in a temporary location.
To save resources, indexing is lazy. For example, if you open a log to see just the first few configuration messages printed at the start of the test, only a few small chunks of the file are quickly indexed and content is immediately available. However, performing a narrow search might require the full index to be built. Once the index is built all subsequent operations are fast, regardless of the log size.
Tip
From the main menu you can choose to continue indexing in the background and return to a fully indexed log later.
Tip
Press the top right refresh button to bring in new content, for example when the current log is being actively generated.