Debugging a Simulation
To interactively debug a simulation, double click on the editor left vertical bar to add breakpoints and start the simulation in debug mode.
The Run and Debug activity is activated, which provides dedicated debug actions and views.
Simulation suspends automatically when a breakpoint is hit. The currently executed line is brought into focus. Using dedicated views you can inspect the call stack and values of variables. You can drive the simulation by stepping over lines or into / out of methods.
When simulation is suspended any changes you make are incrementally analyzed and take effect immediately in the ongoing simulation run, also known as debugger hot-swap. This is a very powerful feature that gives you instant execution feedback and a massive speed-up when iterating fixes.
Note that currently hot-swap only works for changes made to method bodies inside classes. If changes cannot be hot-swapped, for example if you edit a module, you will be prompted to either continue the simulation out of sync with source code, restart it with changes applied or terminate it. If you choose to continue, the compilation database gets updated when simulation finishes.
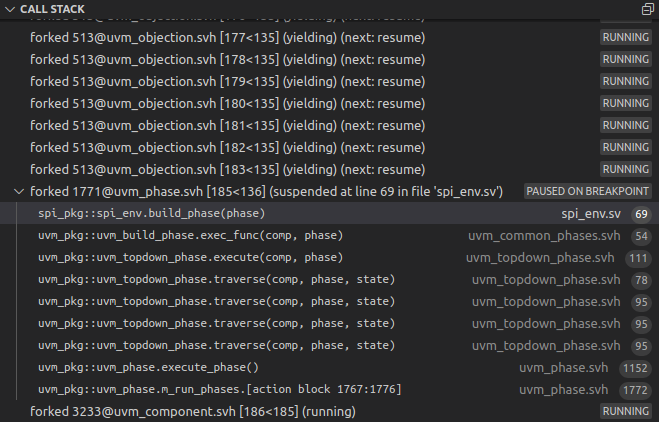
The Call Stack View presents all the threads and the current call stack.
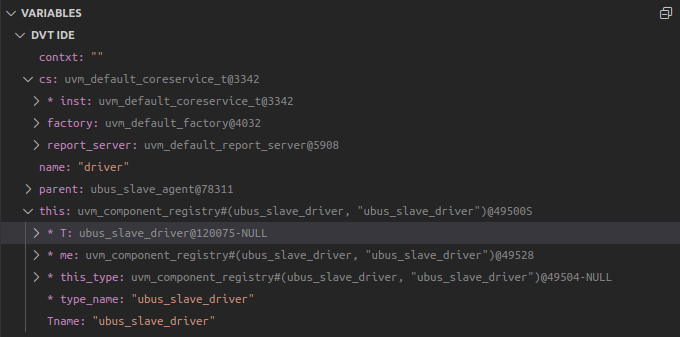
The Variables View presents variable values in the current scope.
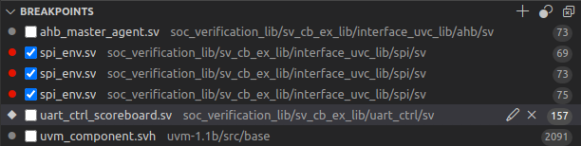
The Breakpoints View presents all the breakpoints and their enablement state.
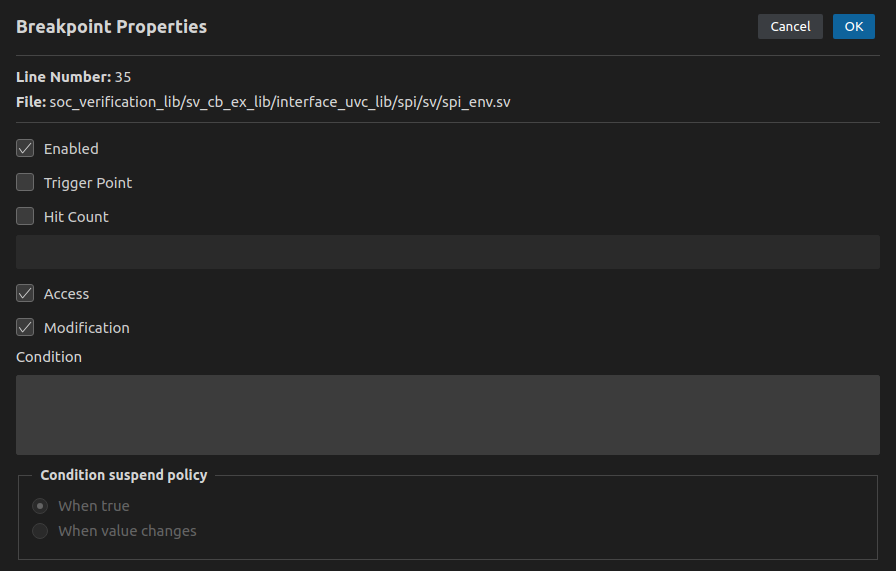
You can add Conditional breakpoints to suspend execution only when a specific condition is met. Right click on the left vertical bar and select Add Conditional Breakpoint….

You can further configure other attributes by right clicking on an existing breakpoint and selecting Breakpoint Properties….
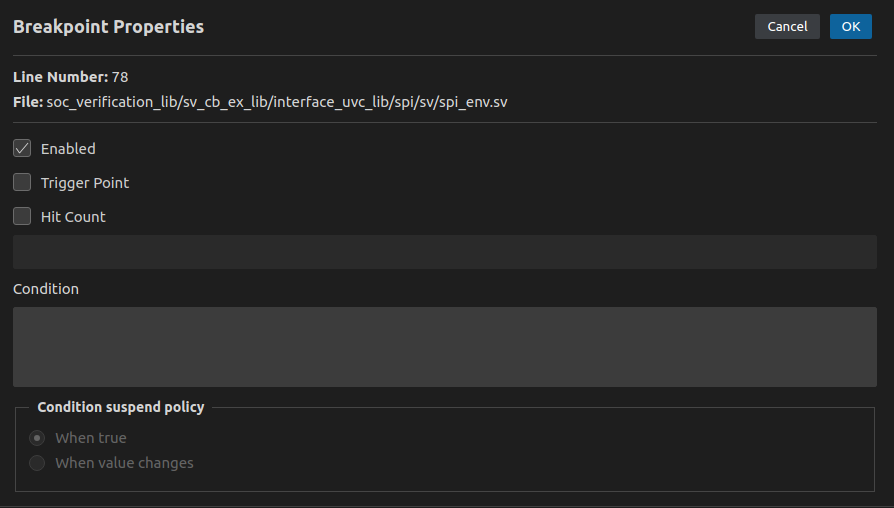
Enable Trigger Point to use the selected breakpoint as a trigger point. All the other breakpoints are enabled only after any of the trigger points has been hit.
Set a Hit Count value to suspend the execution only when the breakpoint is encountered for the hit_count time
You can also add printouts without altering the source code by using logpoints. Right click on the left vertical bar and select Add Logpoint…. You can use only a $display() statement in the editable textbox below the breakpoints list, however its arguments may call other functions.

Watchpoints tell you exactly what line of code causes a variable to change. You can add a watchpoint by clicking on the editor vertical bar next to a global variable declaration or a method argument.
By default, execution is suspended whenever the value of the given variable is accessed or modified. You can choose when to stop execution by configuring the Access/Modification checkboxes in Breakpoint Properties.