DVT Run Dashboard
The DVT Run Dashboard is the simulation configuration and control interface.
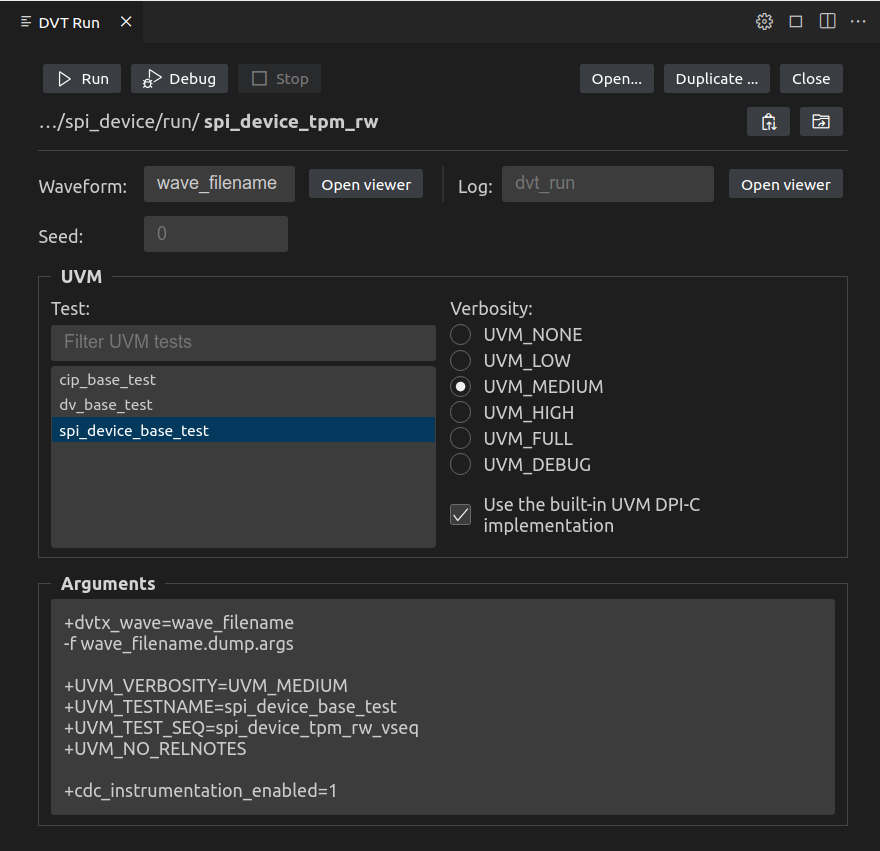
The following actions control the simulation:
Run: Starts the simulation.
Debug: Starts the simulation in debug mode, see Debugging a Simulation.
Stop: Stops the simulation in progress.
Note: when you use the DVT: Run simulation command:
if a run dir is not opened, the default
dvt.runrun dir is opened automatically (created if it does not exist yet)if the
dvt_run.argsfile doesn’t exist in the opened run dir, it is created and the DVT Run Dashboard is opened, giving you the opportunity to configure the simulationif the simulation is already configured in the run dir (that is,
dvt_run.argsexists), the simulation starts right away
The simulation run dir is shown at the top of the dashboard. The following actions are available for simulation run dir management:
Open a different run dir.
Close the current run dir.
Duplicate the current run dir. A new directory is created and opened, with the configuration copied over as-is from the current one (dvt_run.args, waveform configurations, etc). Useful if you want to keep a snapshot of a run (configuration and artefacts) instead of overwriting.
Tip: use the buttons next to the run dir label to copy its full path to clipboard or show it in the Explorer.
For more details see Working with Run Dirs.
The following actions provide quick access to simulation artefacts:
Open waveform viewer opens the simulation wave dump, by default dvt_wave.dst. If the waveform dump file does not exist yet, it opens the viewer in a draft mode, allowing you to add signals and configure the viewer upfront.
Note that when you launch the simulation, if a waveform name is specified using +dvtx_wave+<name> but no +dvtx_wave_dump+<...> args are present, the tool will inform you and offer to automatically configure dumping based on the current Waveform Viewer configuration. From the waveform viewer you can also explicitly export dump configuration arguments for the added signals to a file. To dump everything, simply specify the +dvtx_wave_dump+ALL run argument, but be mindful of the potential performance penalty. See also All Run Directives.
Open log viewer opens the simulation log file, by default dvt_run.log.
In the dashboard you can specify runtime arguments (plusargs) for the simulation. Dedicated UI widgets are provided for popular arguments such as the random seed or UVM test and verbosity. Every widget translates to a plusarg. The arguments textbox shows all run args and is always kept in sync with the widgets.
The following inputs are only available for UVM projects:
UVM Test selection translates to
+UVM_TESTNAME=<test>UVM Verbosity selection translates to
+UVM_VERBOSITY=<verbosity>Use Built-in UVM DPI-C Implementation checkbox translates to
+dvtx_native_jimpl_uvm; by default a built-in speed-optimized version of the UVM DPI-C implementation is used, uncheck to compile and use UVM C sources
The waveform field translates to +dvtx_wave+<wave_name>, and the log field to +dvtx_log+<log_name>.
For a full list of DVT specific runtime arguments see All Run Directives.
Note that the dvt_run.args file in the run dir is kept in sync with the dashboard (changes are instantly reflected both ways).
Closing the DVT Run Dashboard while a simulation is in progress does not impact the simulation. You can open it / bring it into focus at any time using the status bar button.