Simulator
Getting started
DVT IDE includes an IEEE 1800-2023 SystemVerilog simulator that runs in interpreted mode. Once a project is built, you can start a simulation by using the DVT: Run simulation command. On the first run, this brings up the DVT Run Dashboard.
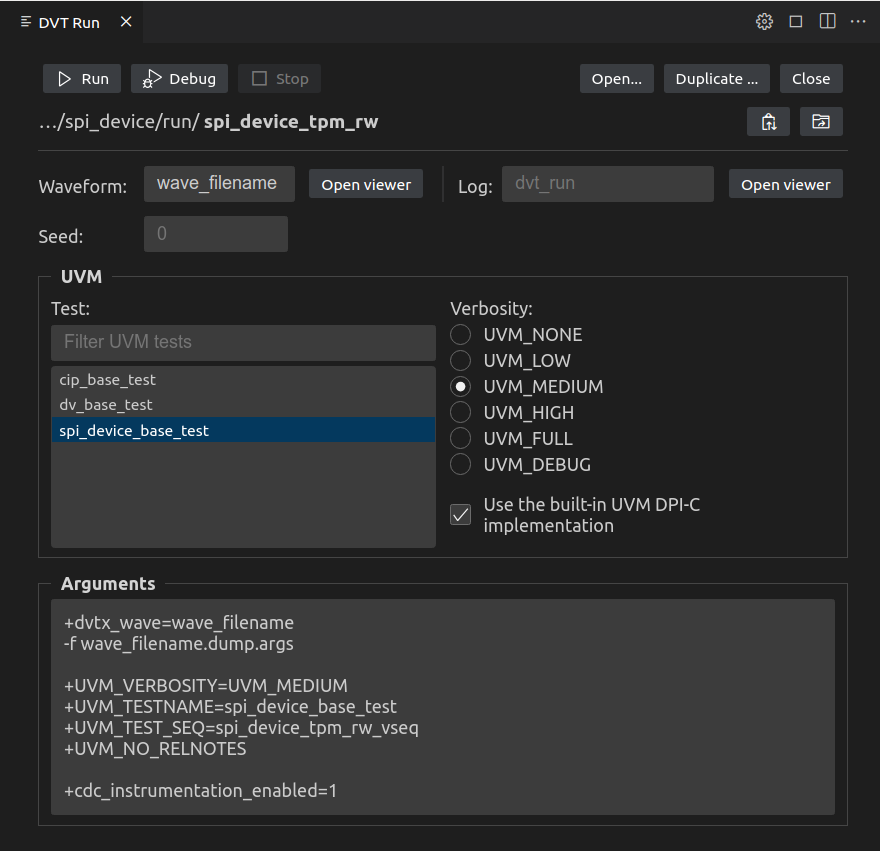
Here you can specify run arguments such as the seed or any plusargs. If working with UVM, dedicated widgets are provided for selecting the test and verbosity.
Open the Waveform Viewer and add to it the signals that you want to dump, either from the Design Hierarchy View or directly from the editor.
When done, click either Run or Debug to start the simulation.
Simulation output is shown in the Console, where errors and messages are hyperlinked to source code. The waveform viewer is updated on the fly as simulation progresses. If your project includes a UVM testbench, the Verification Hierarchy, Registers, Factory Overrides and Config DB views are also updated to reflect actual runtime testbench structure and configuration.
When running in debug mode, simulation suspends when breakpoints are hit, and you can perform stepping operations, inspect variables and evaluate expressions. Furthermore, your changes to code are incrementally analyzed and hot-swapped into the run in progress, allowing you to get instant execution feedback.
The indicator in the status bar shows the current run directory and simulation status (running/debugging, simulation time):
Not running |
Running |
Debugging |
|---|---|---|

|

|

|
Simulation executes in a run directory, by default dvt.run in the project root.
Runtime arguments are serialized into the dvt_run.args file.
Simulation artefacts such as the waveform dump and log file are also generated in the run dir.
To stop a running simulation use the Stop button in the view or the DVT: Stop simulation command.
Note that DVT AI Assistant and AI Agents running in the DVT IDE can also control the Simulator via dedicated tools. See MCP Server.