Views
Call Hierarchy View
The Call Hierarchy view presents the call tree of a function or task.
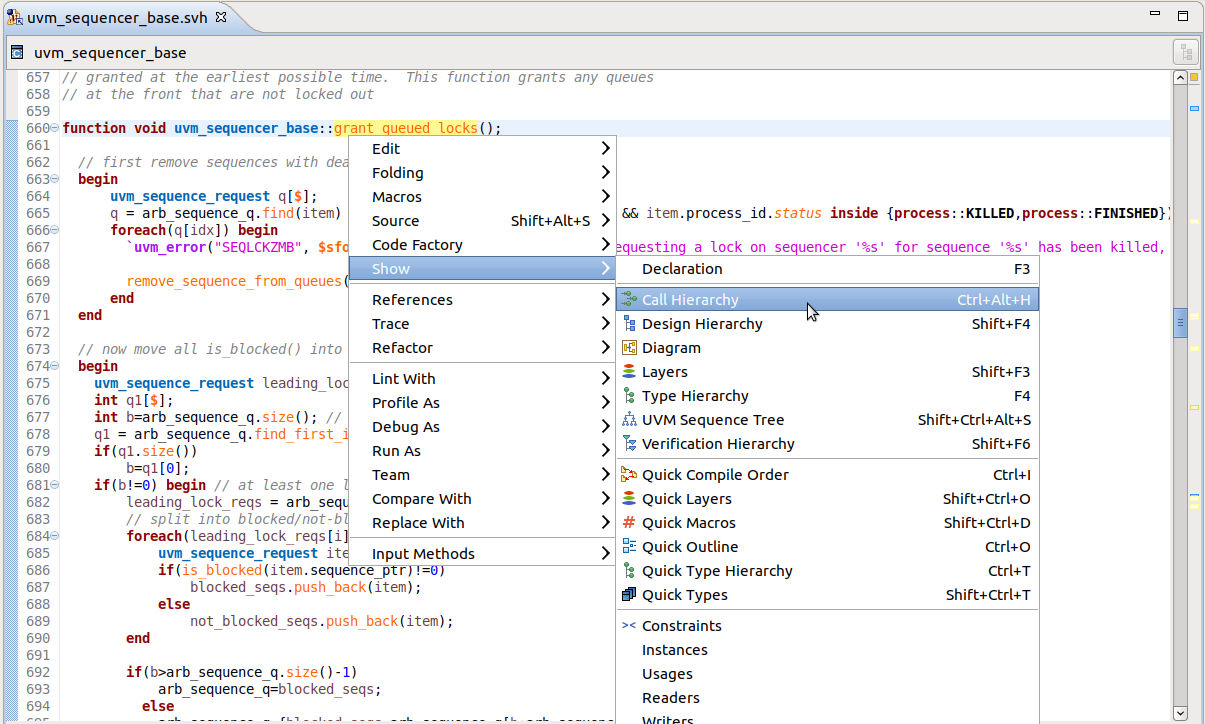
Place the editor cursor on the desired element, right-click, and choose , or press Ctrl+Alt+H.
Using the buttons in the toolbar(see below), you can select the Call Hierarchy Strategy based on your needs.
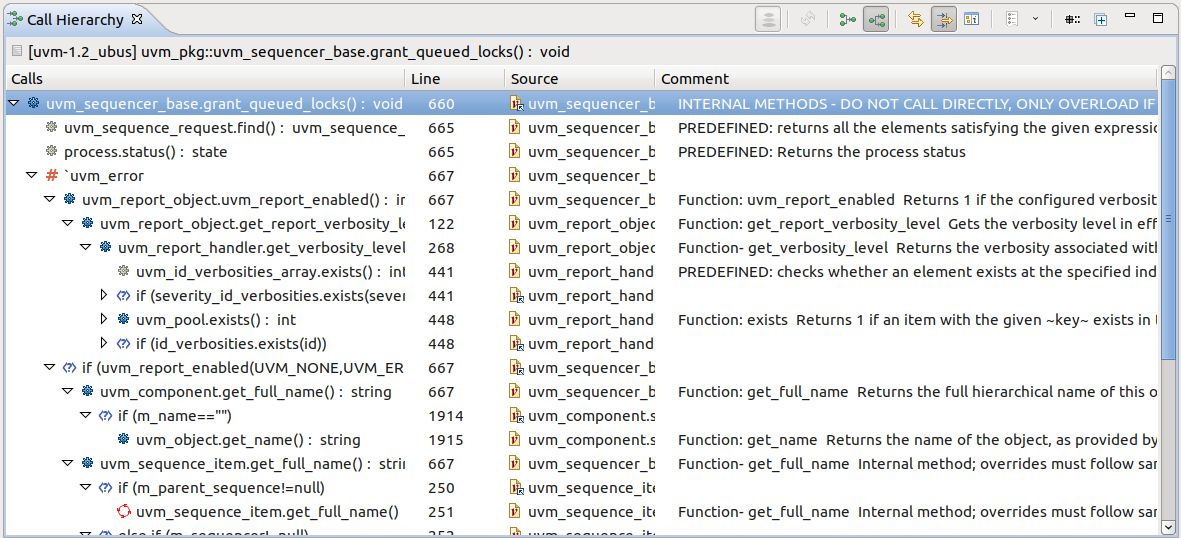
The Callee Hierarchy Strategy shows method calls in the selected function or task. You can expand nodes in the tree to further inspect the hierarchy.
Note
Conditional (if / case) and fork blocks are also shown. You can hide them using the Filters… toolbar button.
Note
To show labeled blocks in the view use the Filters… toolbar button.
Note
When calling a virtual method on a base class handle, any of the child overrides of that method may be executed, depending on the runtime object type. In addition to the method call, you may choose to see all calls from overrides, using the Filters… toolbar button.
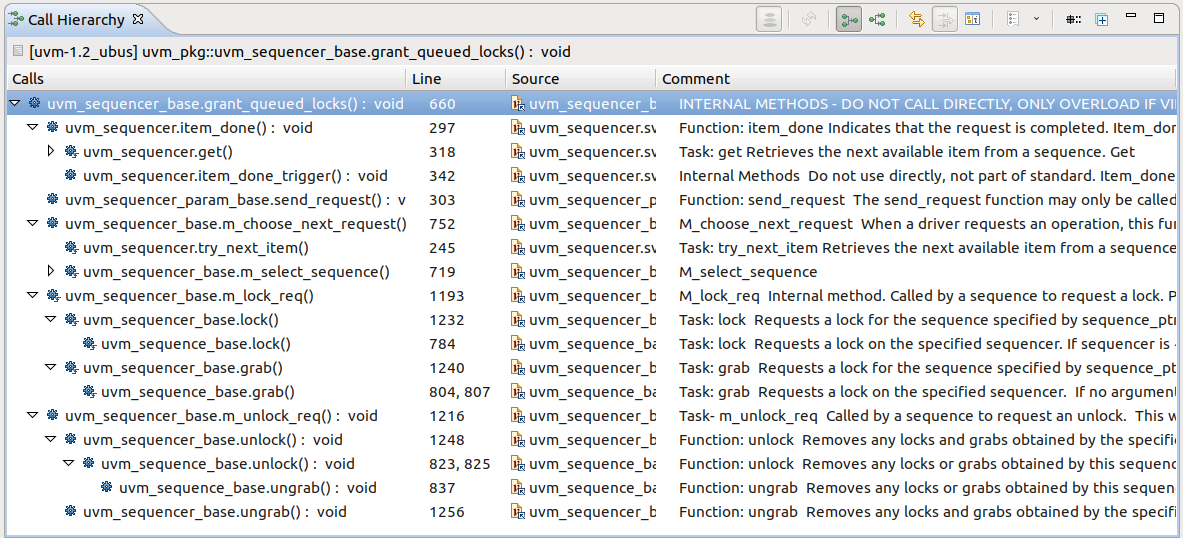
The Caller Hierarchy Strategy shows method calls of the selected function or task.
Note
When calling a virtual method on a base class handle, any of the child overrides of that method may be executed, depending on the runtime object type. In addition to the method call, you may choose to see all method calls of the parent function implementation, using the Filters… toolbar button.
Note
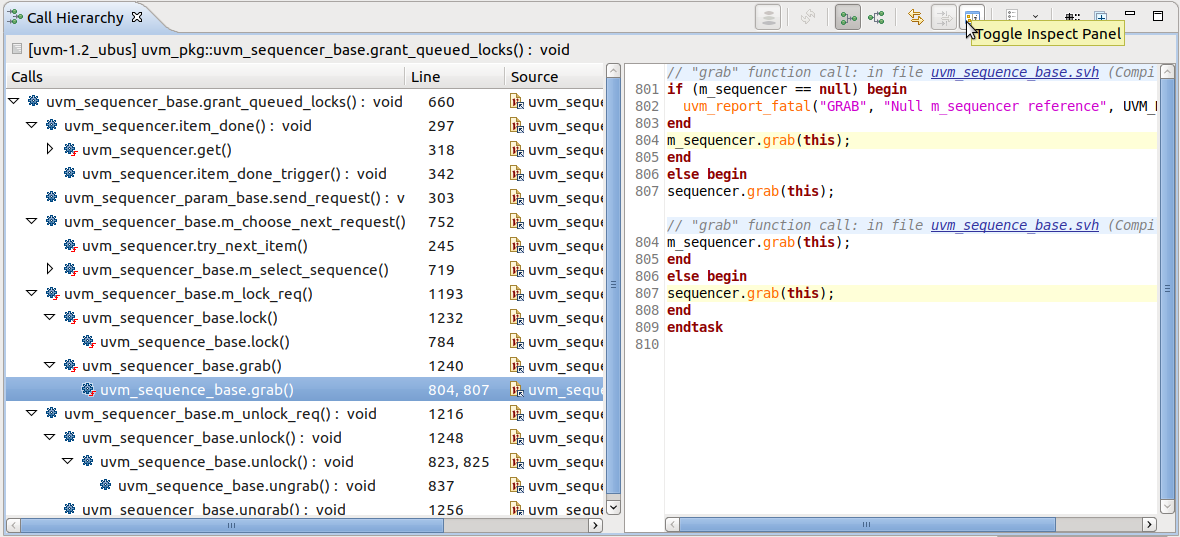
When using the Caller Hierarchy Strategy, the view compacts all function/task calls from the same scope into a single node, with multiple lines specified in the line column.
If you want to see all the function calls from the same scope, you can open the Inspect Panel and select the node in the Call Hierarchy View.
Note
The same input appears in the Inspect View, if you wish to use it instead.
Tip
When using the Caller Hierarchy Strategy, if the Call Hierarchy is triggered on a field, it shows field references in functions/tasks on the first level, then method calls from the second level onwards.
Tip
Double click on any node to jump to the method call. In Caller Hierarchy Strategy the editor will jump to the first method call if multiple are available in the same scope.
Tip
Use Up and Down arrow keys to navigate the view, Left to collapse and Right to expand.
Tip
Right-click on a node to:
Remove from View Remove selected node from the tree.
Expand Children Expand all children of the selected node.
Expand Multiple Levels Expand a custom number of levels from the selected node.
Go to First Call Jump to the first call of a recurrent method call.
Go to Declaration Jump to the declaration of the selected method.
Toolbar

|
Caller Hierarchy |
Switch strategy to caller. Also refreshes the view. |

|
Callee Hierarchy |
Switch strategy to callee. Also refreshes the view. |

|
Refresh View |
Recompute the call tree if dirty (see below). |

|
Link with editor |
Link tree selection with editor. |

|
Filters |
Hide conditional, fork or override nodes. Changing filters requires refresh (see below). |

|
Prepend Package Name |
Show package name in labels. |

|
Expand Multiple Levels |
Expand a custom number of levels. |

|
Toggle Inspect Panel |
Show/hide the inspect panel embedded in the view. |

|
Analyze all root method extensions |
Analyzes root method extensions (disabled, only available for e Language). |
Icons

|
Conditional block (if / case) |

|
fork block |

|
Function call |

|
Predefined function call |

|
Static function call |

|
Function override |

|
Task call |

|
Static task call |

|
Task override |

|
Field node |

|
Constructor call |

|
Predefined constructor call |

|
Let call |

|
Macro call |

|
Recurrent method call |

|
Call to undeclared method |

|
Labeled block |
Refresh
The Call Hierarchy view is not automatically updated at incremental build or when modifying filters.
When you decide it’s time to recompute the view contents, simply click the Refresh toolbar button.

Note
Refresh may not retain the state of the method call tree.
Checks View
The Checks View presents all the immediate, concurrent, deferred immediate assert and assume constructs in the project.
Open the view from menu Double click on a check and jump to the source location.

|
immediate assert |

|
concurrent assert |

|
deferred immediate assert |

|
immediate assume |

|
concurrent assume |

|
deferred immediate assume |
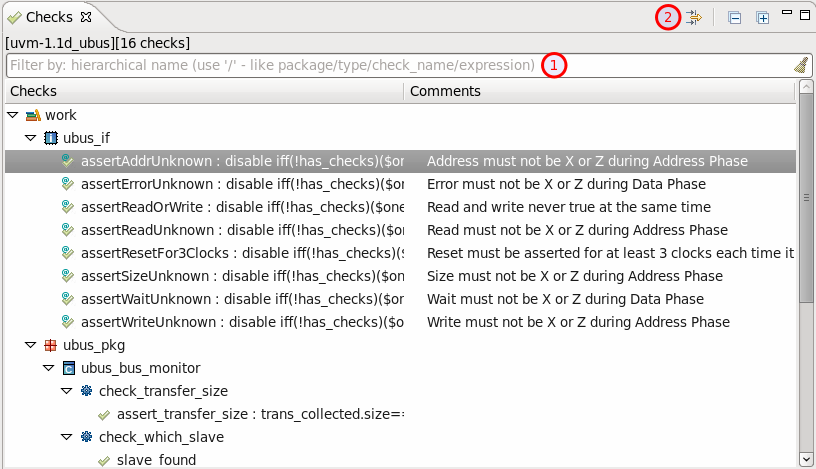
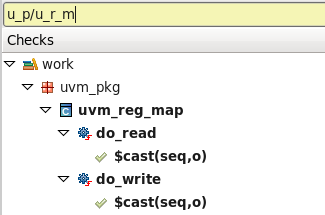
Quick Search. You can use CamelCase, Simple Regex or Hierarchical Search to locate a specific element. By default, hierarchical search will show all descendants:
Check Kind Filters. You may choose to hide immediate, concurrent assertions or assumptions - see the image below:

Code Templates View
The Code Templates is located near the Navigator and Hierarchy views or you can open it from .
To insert a template in a code editor, you can either:
drag and drop it in the editor at a specific location
double click on it
click on Insert into editor button
right-click on it > Insert
Note
If you choose one of the last three actions mentioned above, the template will be inserted in the current editor at the current cursor’s positon. Please make sure you have an opened editor and the cursor is at the right position before adding the template!
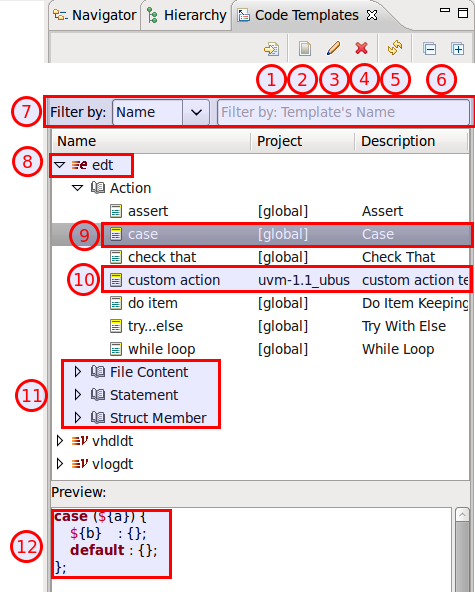
Insert the selected template into the current editor
Create a new template
Edit the selected template
Remove the selected template (NOTE: you cannot undo this operation!)
Refresh the view (if it doesn’t automatically update when you modify templates/projects etc.)
Collapse/expand all
Filter templates (you can filter them by: nature, context, name, project, description)
Templates’ natures
Templates’ contexts
Preview the template’s pattern (it automatically updates when clicking on a template)
To create a new template, click on Create a New Template button on the toolbar:
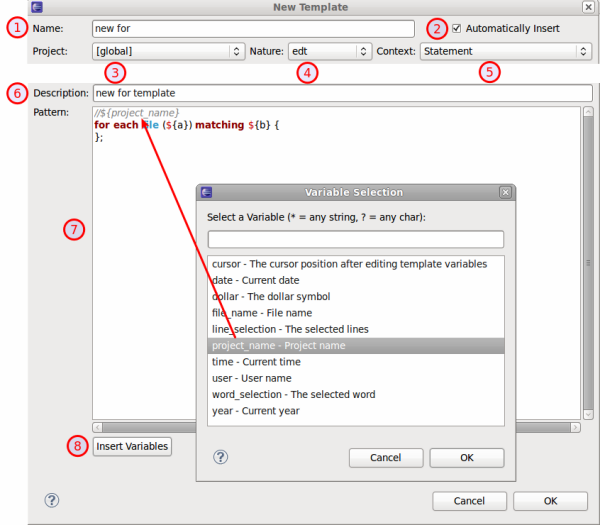
Template’s name
Check Automatically insert if you want the template to expand automatically on Ctrl+Space when there is no other matching template available. It is usually good idea to leave the checkbox checked, otherwise you would get a template proposal “popup”
Each template must be created under a project available in the current workspace (select [ global ] for a global template)
Assign a nature - only natures relevant to the selected project will be displayed
Template’s context - only contexts relevant to the selected nature will be displayed
Templates’s description
Code Pattern - embed variables in ${} e.g. ${variable_name} to enable the template proposal wizard when inserting the template into an editor
Insert variables - here you can find some useful misc. predefined variables
Compile Order view
The Compile Order View presents the hierarchy of compiled files as it results from the `include compiler directives, starting from the project top files.
Open the view from menu .
Double click on a file to open it.
You can use CamelCase or Simple Regex to locate a specific element.
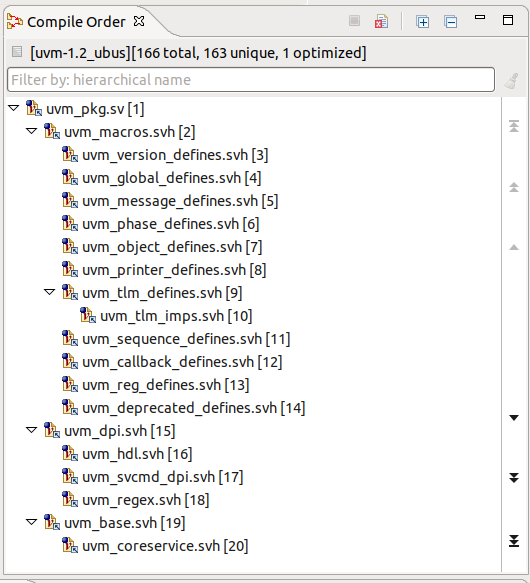
The Compile Order View label presents the following statistics:
Total |
The total number of compiled files (the largest compiled file index). Note: Files compiled in optimized mode, -v and -y library files are added to this count. |
Unique |
The number of unique files in Compile Order View. If a file is compiled multiple times with multiple compile indices, it will only be counted once to determine “unique” value. |
Optimized |
The number of files compiled in optimized mode (files that are `included in the project multiple times, in the same invocation and same pre-processing context). |
For projects with multiple natures, only the Total appears in the Compile Order label. Each language node contains information about total, unique and optimized for that language.
Right click on a file then Go To Include to jump to the include location.
Note
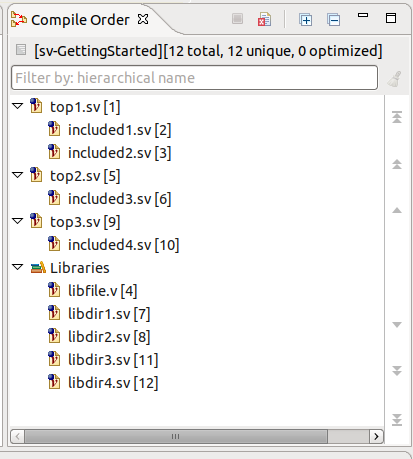
Library files compiled using -y and -v directives are aggregated under a dedicated section in the Compile Order, and consequently there may be discontinuities in the compile index:
Build Config Hierarchy
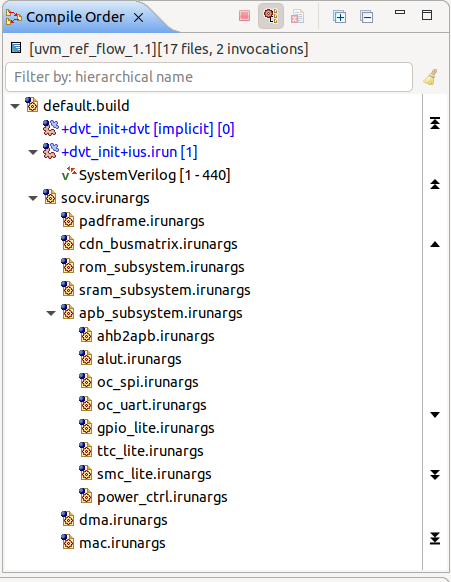
Press Show Build Config button to open the build config hierarchy as it results from the ‘-f’ compile directives, starting from the active build configuration.

Note
Each invocation section will be added under the coresponding build configuration file.
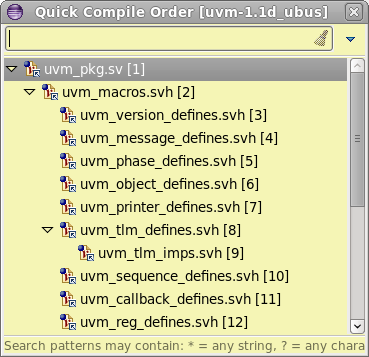
Quick Compile Order View
Press Ctrl+I to quickly open a compiled file.
The Quick Compile Order View will pop-up and and present a filterable list of all the compiled files in the project.
You can use CamelCase or Simple Regex to locate a specific element.
Select a file and press Enter or click to open it.
Config DB View
The Config DB View shows all operations performed on the UVM Configuration Database via uvm_config_db set and get method calls.
Open the view from the UVM menu > Show Config DB. The view is populated only after setting a runtime elaborated Verification top.

By default, set and subsequent get calls for a specific configuration setting are clustered together and shown under the Setters and Getters section. Setters without Getters and Getters without Setters are shown in separate sections.
To see set and get calls in a flat list sorted by execution index, click the Sort By Execution toolbar button.
The view columns represent:
Call: The configuration method, either set or get, followed by the execution index between square brackets.
Type: The configuration object type.
Context: The verification hierarchy path to the context component.
Instance name: The verification hierarchy to which the configuration is applicable.
Field name: The configuration target field name.
Value: The actual value of the configuration object.
The quick search bar applies to any of the view’s columns.
Note
The view presents only set and get calls up to the end of elaboration phase.
Using the Filters toolbar button you can:
Hide unassociated UVM Config DB Setters (setters without getters)
Hide associated UVM Config DB Setters and Getters
Hide unassociated UVM Config DB Getters (getters without setters)
Hide UVM Config DB Setters for read only resources
Tip
Double-click to go to the set or get method call.
Tip
Right-click on a node to copy the content of the Instance Name or Field Name columns to the clipboard.
Console View
Any invocation (for example a DVT Generic run) output is dumped to the Console View.
The Console View is automatically raised at any invocation.You can also go to menu to open the Console View.
Click on hyperlinks in the Console View to jump directly to the to source location.

Coverage View
The Coverage View presents all the coverage groups and items in your project.
Open the view from menu .
Double click on a group or item and jump to the source location.

|
cover group |

|
simple item |

|
cross item |

|
transition item |
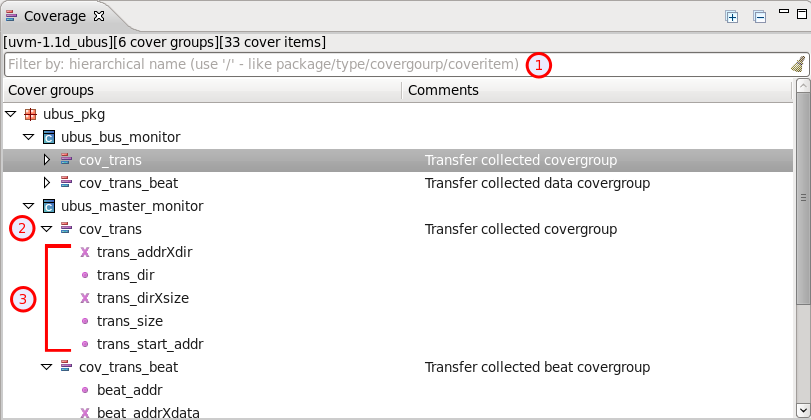
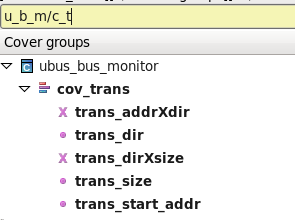
Quick Search. You can use CamelCase, Simple Regex or Hierarchical Search to locate a specific element. By default, hierarchical search will show all descendants:
Cover Group.
Cover Items.
Design Hierarchy View
The Design Hierarchy View presents recursively the instances in a Verilog module or the instances in a VHDL entity or component implementation. Cross-language design hierarchies are also supported.
Position the editor cursor on the name of a design element and press Shift+F4 or right-click and choose from the context menu.
The Design Hierarchy View opens with the chosen element set as the top of the hierarchy. You can also go to menu to open the view.
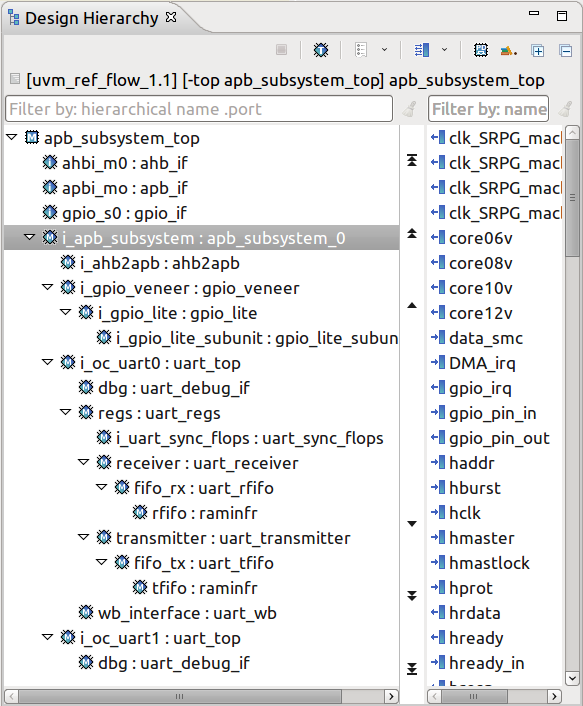
 Cancel Current Operation Stops the view operation in progress, for example a search.
 Select Top A drop-down menu/pop-up dialog to select from top modules for Verilog or top architectures for VHDL. For Verilog, a top element is a module that instantiates other design elements and it is not itself instantiated. Similar for VHDL top architectures.
 History List Click to see the previously inspected elements.
 Show/Hide Ports Shows or hides the ports of the selected element. You can set the ports panel to the right or below the hierarchy.
 Show PD Shows or hides power domain information. You can choose to see the power domain names in the node labels, and distinctive foreground or background colors for all nodes belonging to the same power domain.
 Prepend Library Prepend to the node label the name of the library to which the instance belongs.
You can scroll through the tree of instances using:
the mouse scroll wheel
the Up arrow, Down arrow, PgUp, PgDn keys
- the vertical button bar on the right side of the tree
 go to top of tree
 up one page
 up one element
 down one element
 down one page
 go to bottom of tree
Note
The up/down buttons are grayed out when reaching the top/bottom of the tree.
You can double-click on an instance to go to its declaration. Double-click on a port to go to where it is connected.
Right-click on an instance in the hierarchy and you have the following options :
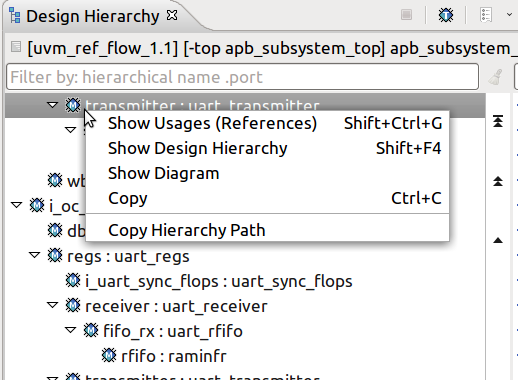
Show Usages (References) Search for the references of the selected instance. More details Show Usages, Readers or Writers
Show Design Hierarchy Show the design hierarchy starting from the selection.
Show Diagram Show the design diagram for the current selection. More details Design Diagrams
Copy Copy the label text of the selected instance to clipboard.
Copy Hierarchy Path Copy the hierarchy path of the selected instance to clipboard. You can change the segment separator from .
Right-click on a port and you have the following options :
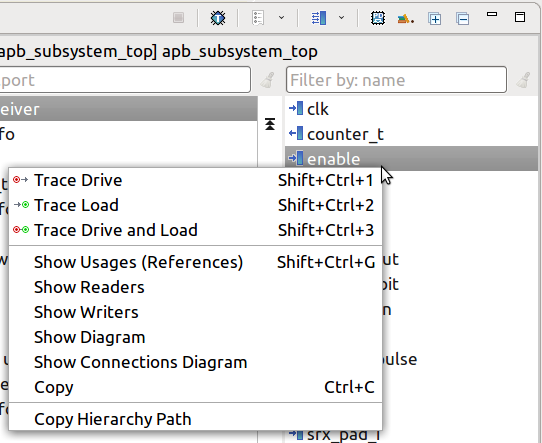
Trace Drive / Load / Drive and Load / In Subinstance See Trace Connections View.
Show Usages (References) Search for the references of the selected port. More details Show Usages, Readers or Writers
Readers / Writers See Show Usages, Readers or Writers
Show Diagram Show the Finite-State Machine for the current selection. More details Finite-State Machine Diagrams
Show Connections Diagram Show the Schematic Diagram of the selected port and all the instances connected to it
Copy Copy the label text of the selected port to clipboard.
Copy Hierarchy Path Copy the hierarchy path of the selected port to clipboard. You can change the segment separator from .
You can use the filters to locate a specific instance or port. You may use slash ‘/’ characters to filter hierarchically one level and ‘//’ to filter hierarchically all the levels. You may use the dot ‘.’ character to filter instances that contain a specific port. The ports that match the filter are promoted to the top of the ports panel. See Quick Search in Views for more details.
No filter. |
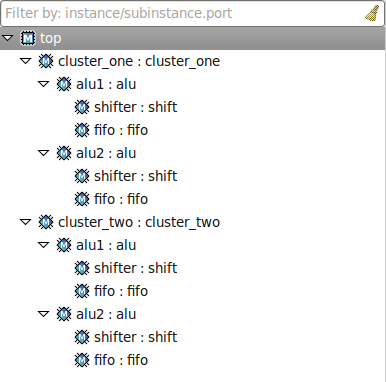
|
Filter by instance name. All instances that contain the filter text are shown. |
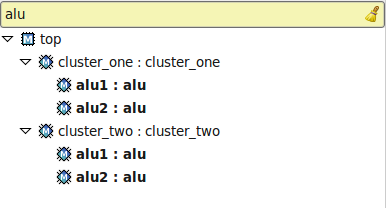
|
Filter strict hierarchy. All instances that contain the filter text and are in a direct hierarchical relationship (father/son) are shown. |
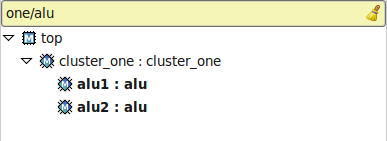
|
Filter non-strict hierarchy. All instances that contain the filter text and are in a direct or indirect hierarchical relationship (ancestor/../../descendant) are shown. |
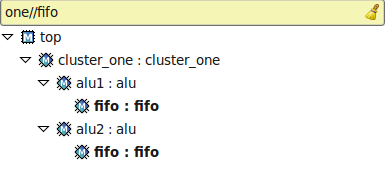
|
Filter strict hierarchy and show all descendants. Same results as for filter strict hierarchy, but including all descendants of the matched instances. |
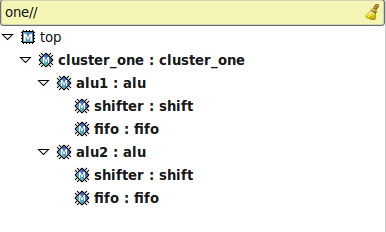
|
Filter strict hierarchy and show direct descendants. Same results as for filter strict hierarchy, but including the sons of the matched instances. |
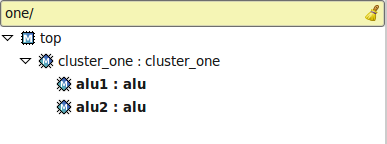
|
Filter by port name. All instances with ports that contain the filter text are shown. |
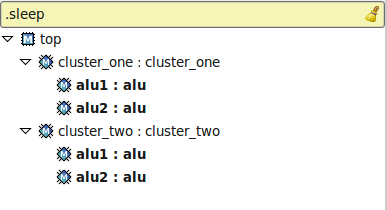
|
Filter by hierarchy and port name. Hierarchical filtering and port filtering may be combined. |
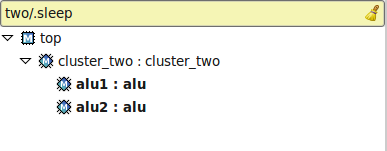
|
Note
To switch to the Old Design Hierarchy View (pre DVT 20.1.1) go to Window > Preferences > DVT and enable Switch to Old Design Hierarchy View
Factory Overrides View
The Factory Overrides View shows the UVM create calls affected by factory overrides.
Open the view from the UVM menu > Show Factory Overrides. The view is populated only after setting a UVM Runtime Elaboration Verification top.

The view content is grouped in three categories:
Direct: Lists all the overrides applied by the UVM factory while creating components or objects during the UVM elaboration. Each entry corresponds to the application of a particular override.
Chain: Groups together all the chained factory overrides that get applied during the creation of a UVM component or object which is subject to multiple overrides.
Unused: Lists all the factory overrides which were not applied during the UVM elaboration.
Note
Overrides meant to be applied after the end of elaboration phase will show up as Unused.
The view columns represent:
Applicable To: The verification hierarchy to which the override is applicable.
Original Type: The type to be overridden.
Override Type: The type created by the factory.
Override Path: The verification hierarchy path of the created object.
Override Chain: The types that make up the override chain, for example if foo overrides bar, and xyz overrides foo, then the chain will show foo > bar > xyz.
The quick search bar applies to any of the view’s columns.
From the Filters toolbar button you can toggle the visibility of each section.
Use the Toggle Inspect Panel toolbar button to see an Inspect Panel embedded in the view. It shows the relevant code sections for the currently selected table row, namely the set override calls and the corresponding create calls.

Tip
Double click any node to go to the create call.
Tip
Use Up and Down arrow keys to navigate the view, Left to collapse and Right to expand.
Tip
Right-click on a node to:
Open Override Call Jump to the applied override call.
Open Original Type Declaration Jump to the original type.
Open Override Type Declaration Jump to the override type.
Open Instantiation Jump to the create call.
Copy Hierarchy Path Copy the content of the Override Path column to the clipboard.
Inspect View
Inspect View shows detailed information about various elements in DVT.
Open the view from menu .
To inspect an element, simply select it in a view or click on its name in the editor.
Information about the selected element will be presented in the view.
Each element shown in the Inspect View starts with an information line regarding the file and line number of the element.
The Inspect View highlights the relevant source code lines of the selected element. These lines may be surrounded with additional source code to provide a context, if necessary.
You can customize the number of lines shown by going to , or by using the key mappings detailed in the Hotkeys chapter below.
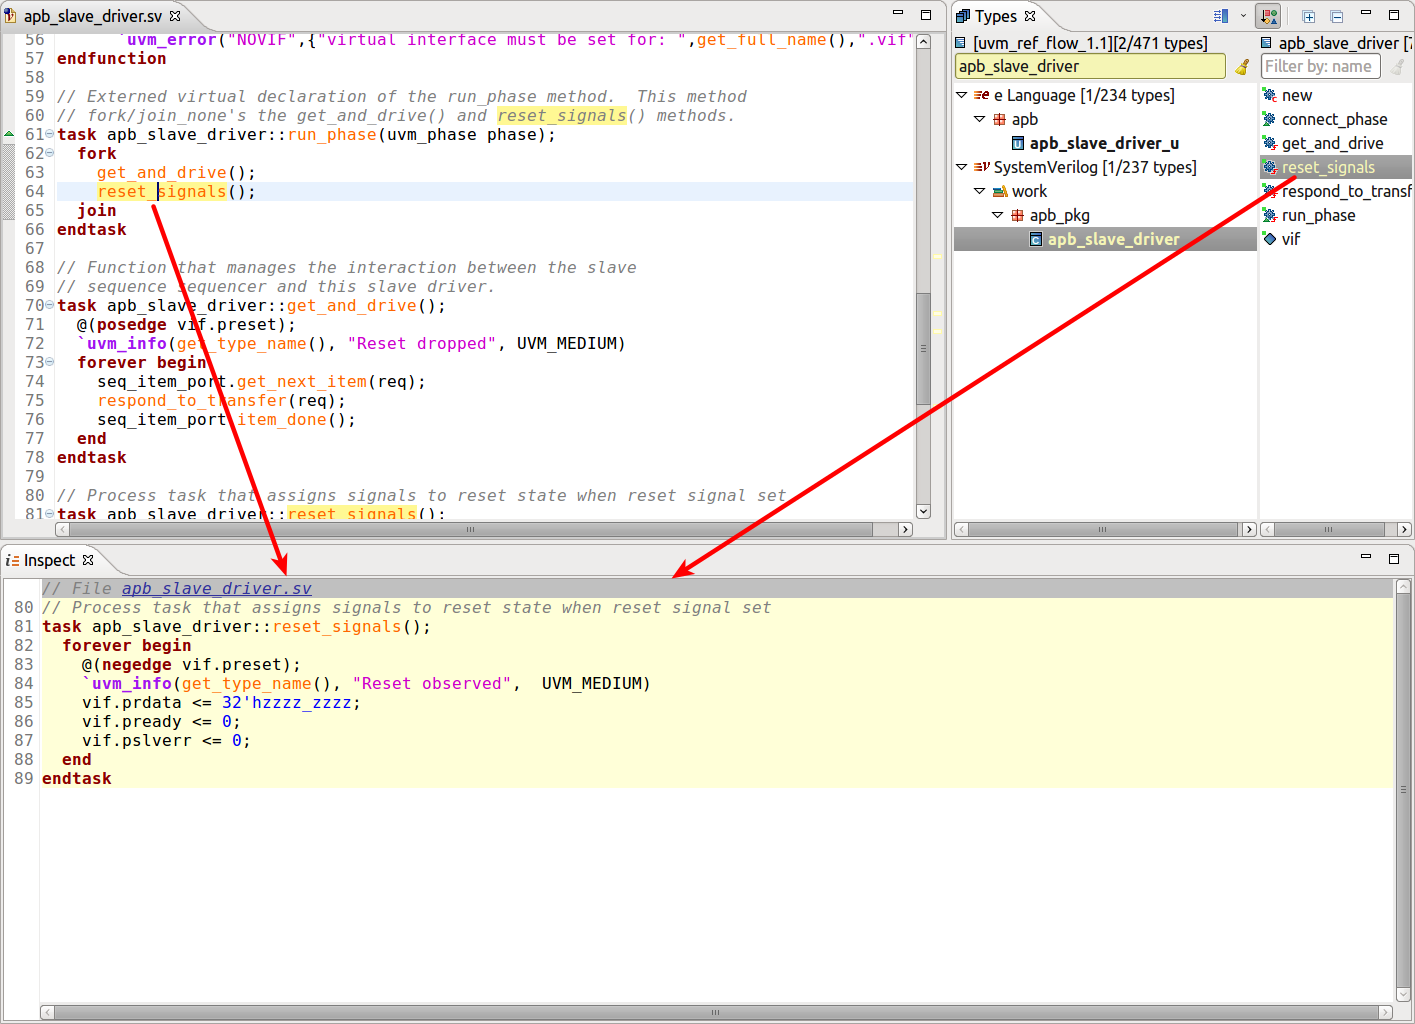
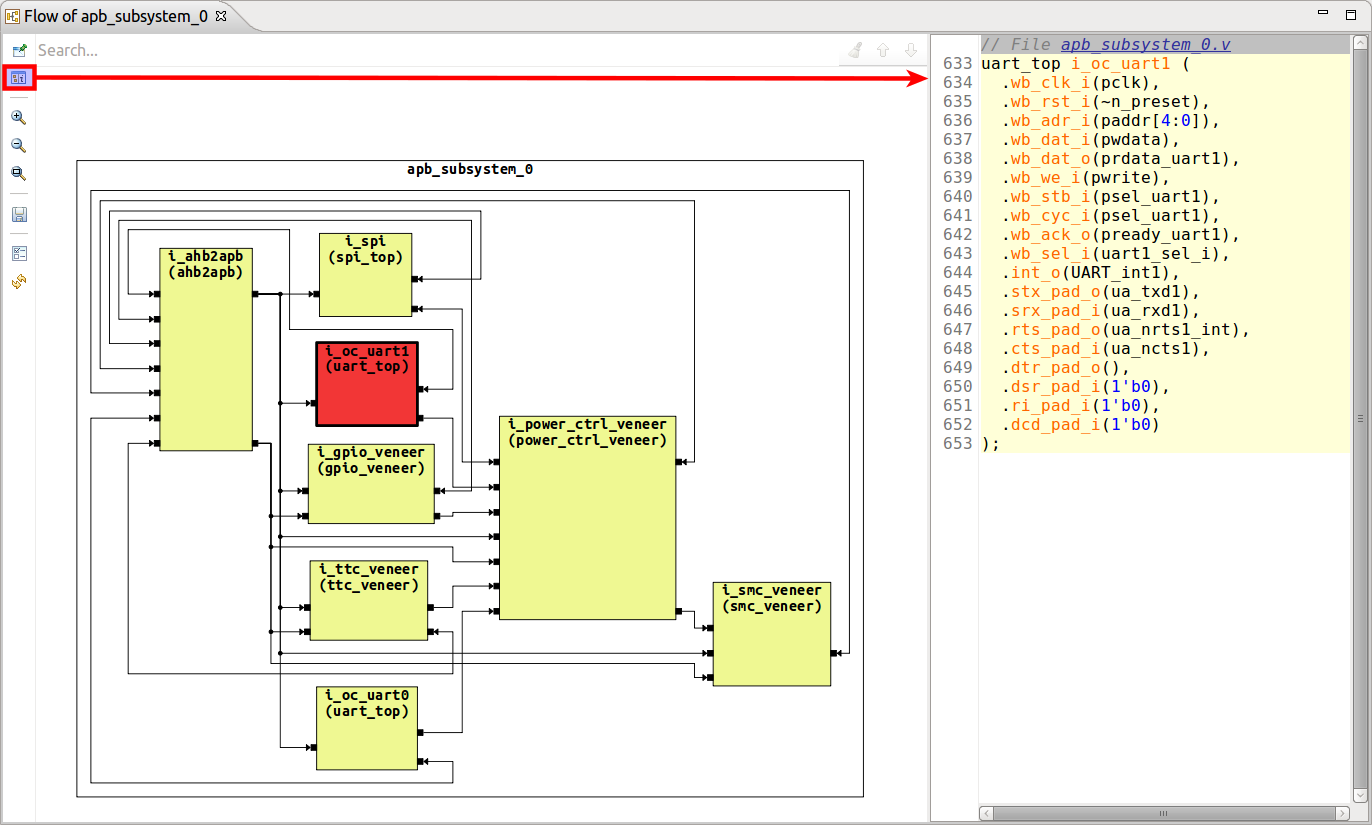
For convenience, you can see the Inspect View embedded in diagrams by clicking the Inspect Panel… button  in the toolbar.
Hotkeys
The following key mappings are available while interacting with the Inspect View.
CTRL+ALT+[ |
Decrease the number of context lines shown |
CTRL+ALT+] |
Increase the number of context lines shown |
CTRL+K |
Cycle through highlighted inputs shown inside the view |
WaveDrom Timing Diagrams
WaveDrom is a tool that draws timing diagrams (waveforms) from a simple textual description written in JSON. DVT renders WaveDrom waveforms in the Inspect View. The waveform diagram is updated on the fly (as you type).
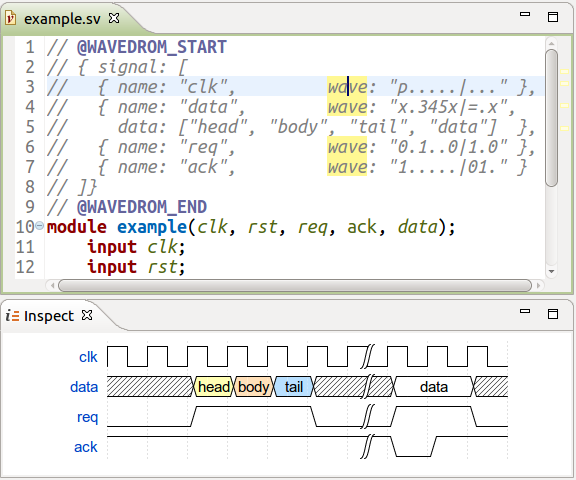
The waveform description can be:
either embedded in comments, surrounded by @WAVEDROM_START…@WAVEDROM_END pragmas
or in files with *.json or *.json5 extensions
When the waveform description is found in a file with a valid extension, the Inspect View will process it’s content and render the diagram when opened. The waveform description file can also be embedded in comments using the @WAVEDROM_FILE pragma, followed by its location. The location of the file will be solved relatively to the project root.
To save the diagram as an SVG file, right-click on it in the Inspect View.
DVT offers the ability to view WaveDrom diagrams through tooltips, by hovering over any waveform written inside DVT editors.
Tip
The WaveDrom documentation is available here.
Note
To specify additional file extensions, use the +dvt_wavedrom_file_ext_add+<extension> build config directive. To clear the extensions list use +dvt_wavedrom_file_ext_clear.
Note
To specify additional search file locations to use in junction with @WAVEDROM_FILE pragma, use the +dvt_wavedrom_files_location_add+<location> build config directive. To clear the extensions list use +dvt_wavedrom_files_location_clear.
Note
By default, only waveform descriptions of maximum 5000 characters are rendered. You can change this threshold from menu Window > Preferences then DVT > Editors.
Note
DVT uses WaveDrom version 3.5.0.
Layers View
For an extern declaration you can quickly see where it is implemented using the Layers View.
Position the cursor on the element’s name and press Shift+F3 or right click and choose from the menu.
The Layers View is automatically raised at any invocation. You can also open it from .
Double click on a layer and jump to the corresponding source location.
Right click on a layer to see its Usages.
You can use CamelCase or Simple Regex to locate a specific element.
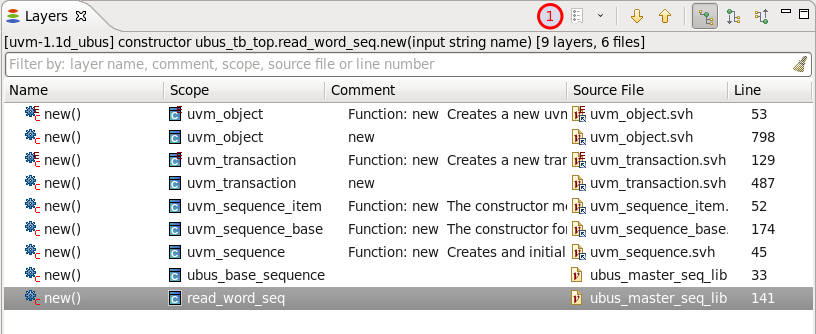
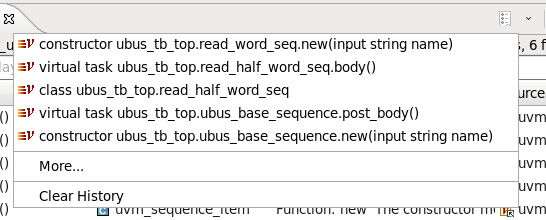
Show History List Click to see the previously inspected layers (see the image below):
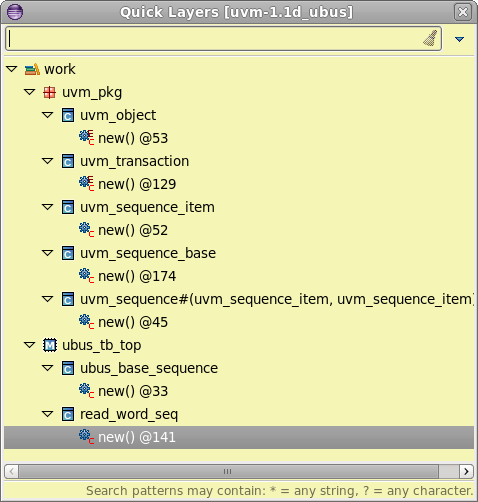
Quick Layers View
Position the cursor on the element’s name and press Ctrl+Shift+O.
The Quick Layers View will pop-up and present a filterable list with all of the selected element’s layers.
You can use CamelCase or Simple Regex to locate a specific element.
Select a layer and press Enter or click to jump to the corresponding source location.
Macros View
The Macros View presents all the preprocessing macros in the project.
Open the view from menu .
Double click on a macro to jump to its definition.
Right click on a macro to view its Usages.
You can use CamelCase or Simple Regex to locate a specific element.

|
Preprocessing define |

|
Preprocessing undefine |

|
Preprocessing ifdef, ifndef |
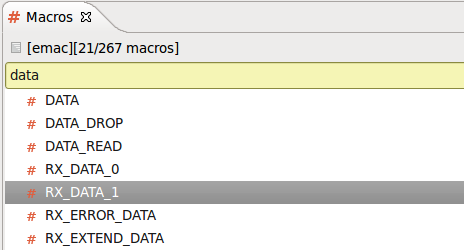
Quick Macros View
Press Ctrl+Shit+D to quickly jump to a specific macro definition.
The Quick Macros View will pop-up and and present a filterable list of all the preprocessing macros in the project associated with the active editor or the current selected project from the Navigator (if no editor is open).
You can use CamelCase or Simple Regex to locate a specific element.
Select a macro and press Enter or click to jump to its definition.
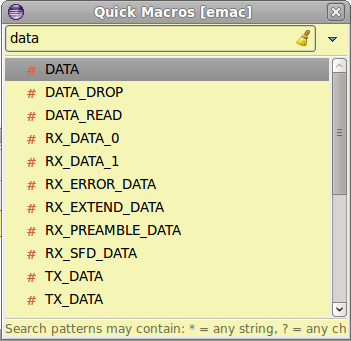
Outline View
The Outline View presents an overview of the editor contents.
Open the view from menu Window > Show View > Other… > General > Outline.
You can click on an entity to jump to its location inside the current file.
You can use CamelCase or Simple Regex to locate a specific element.
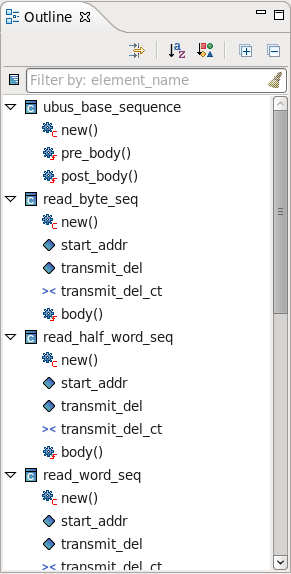

|
Filters… |
Select what elements to show |

|
Alphabetical Sort |
If alphabetical sort is on, all the entities are sorted by name. By default the entities are presented in the definition order. |

|
Category Sort |
If category sort is on, entities are arranged by categories (fields, methods etc.), instead of being mixed as they appear in the file. |

|
Expand All |
|

|
Collapse All |
Quick Outline View
Press Ctrl+O to open the Quick Outline dialog. It presents an overview of your file.
You can use CamelCase or Simple Regex to locate a specific element.
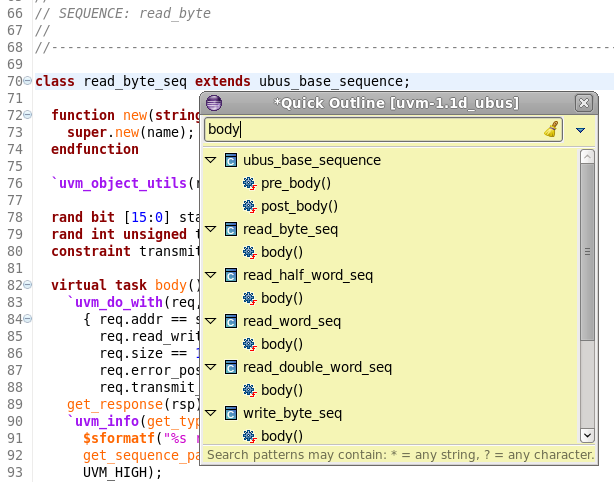
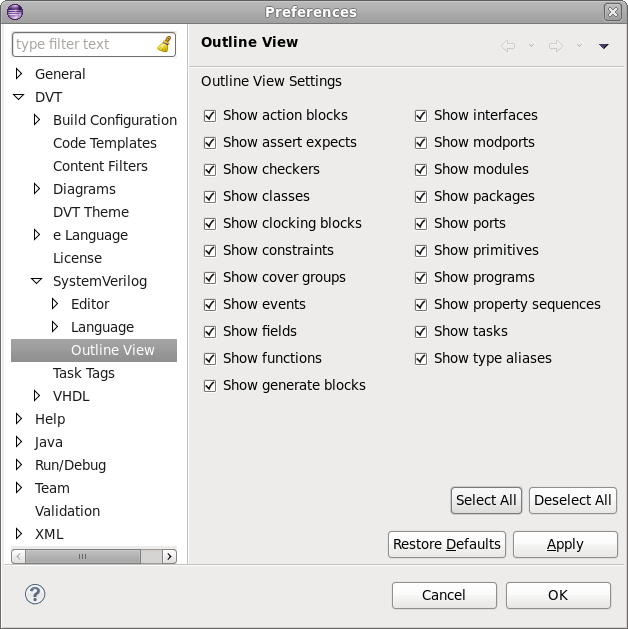
Outline View Preferences
You can configure the Outline View contents from menu .
Power Domain View
The Power Domain View shows detailed information about each power domain created in the project including instances, isolation strategies and retention rules.
Open the view from menu .
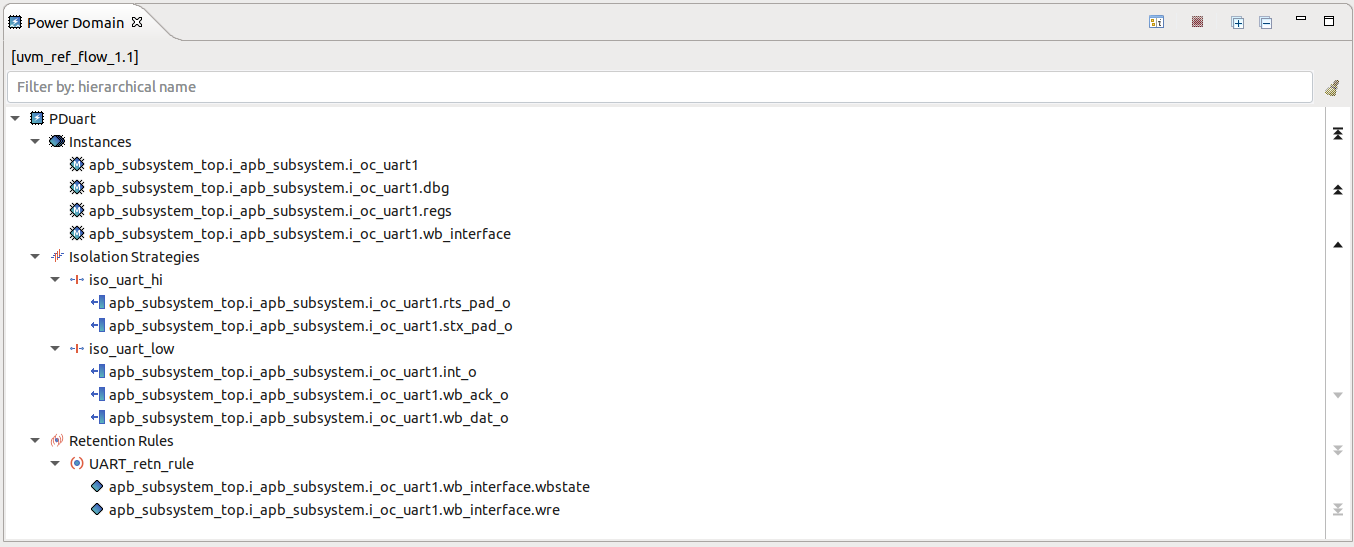
The power domains and their details are displayed in a hierarchical tree format.
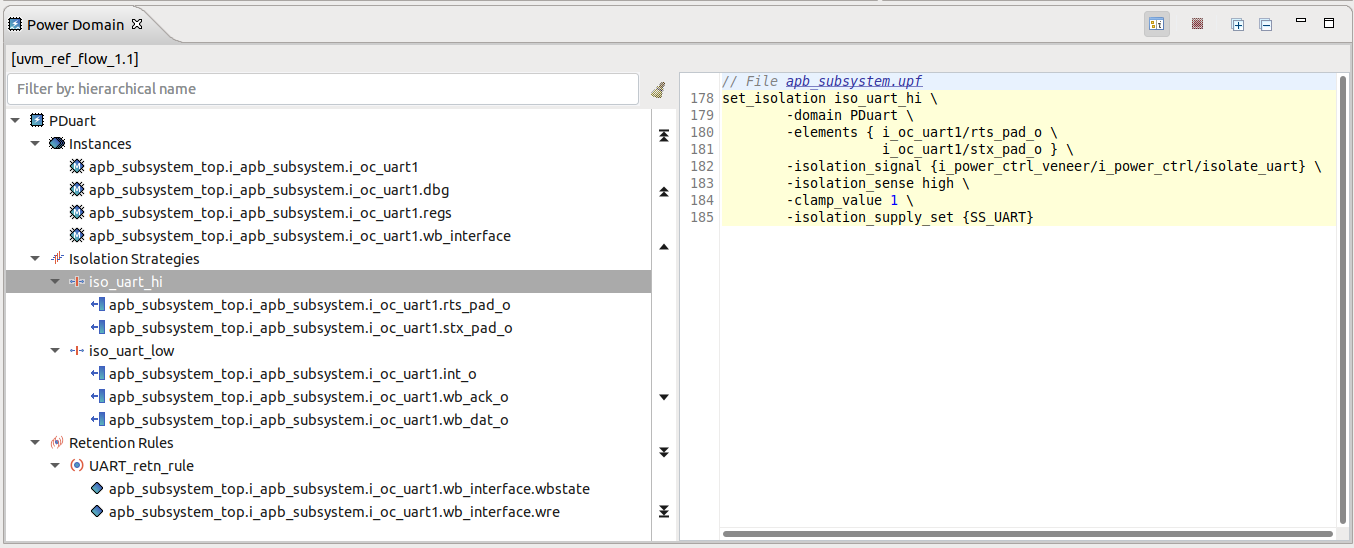
Toggle the Inspect Panel to visualize more details of the currently selected element.
Tip
Double click an element to jump to its declaration.
Tip
To see the including Power Domain of any element,
Problems View
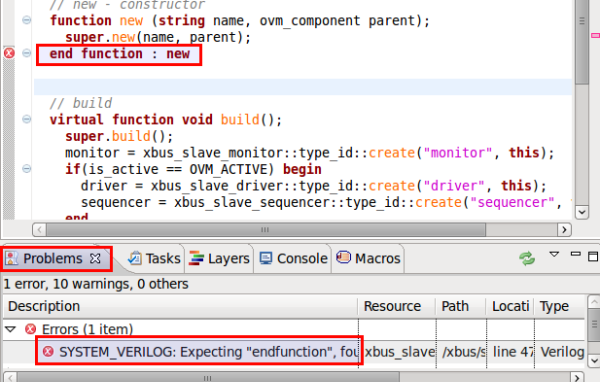
If a project contains errors, for example syntax errors, it will be indicated using decorators:
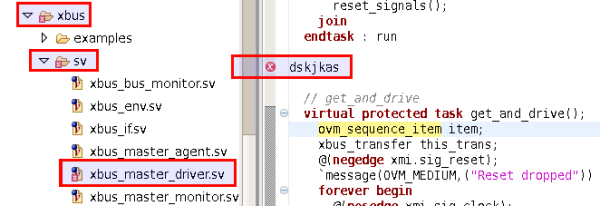
You can use the Problems View to inspect the errors. Open the view from menu . Double clicking on some error will jump to the source location.
Quick Query View
Press Ctrl+Alt+Q to quickly open the Quick Query View, which provides a filterable list of all the types, macros and compiled files in the project.
This view supports semantic search, allowing to look for a specific element. In order to do this, structure your query in the following manner: query_key:search_pattern.
You can use CamelCase or Simple Regex for the search_pattern.
Tip
Use Content Assist to see all the available query keys (CTRL+Space).
DVT supports the following query keys:
checker
class
configuration
covergroup
enum
extends
file
generate
interface
library
macro
module
package
primitive
program
struct
type
typedef
union
Note
The extends:search_pattern query can be used to search for classes which extend other classes that have a name matching the search_pattern.
Note
You can use the type:search_pattern query in order to search for all the types (classes, structs, modules etc.) defined in your project.
Additionally, there are UVM-specific queries that have the following format: uvm_class_name:search_pattern, where uvm_class_name is one of the following:
uvm_agent
uvm_component
uvm_driver
uvm_env
uvm_mem
uvm_monitor
uvm_object
uvm_reg
uvm_reg_adapter
uvm_reg_backdoor
uvm_reg_block
uvm_reg_field
uvm_reg_fifo
uvm_reg_file
uvm_reg_frontdoor
uvm_reg_map
uvm_reg_predictor
uvm_reg_sequence
uvm_scoreboard
uvm_sequence
uvm_sequence_item
uvm_sequencer
uvm_test
Select an element and press Enter or click to navigate to it.
Note
By default, the Quick Query View will display 100 items from each category (types, macros, files). You can customize this value by going to .
Registers View
The Registers View shows all the UVM registers within the register model hierarchy.
Open the view from the UVM menu > Show Registers.

By default the view content is presented as a tree rooted in the register model and comprising of register blocks, register files, and individual registers as leaves.
For each register, the view presents its name, access rights and source code comment. If setting a UVM Runtime Elaboration Verification top, the view also shows the address and associated sequencer for each register.

Toggle the Inspect Panel to visualize the bitfield diagram of the currently selected register.

Tip
Double click to go to the register’s create call.
Tip
From the Display Mode dropdown you can switch to a flat list view, where the name represents a hierarchical path from the reg model to the reg.
Tip
If setting a UVM Runtime Elaboration Verification top, you can choose the Address Radix to be Decimal or Hexadecimal.
Tip
If setting a UVM Runtime Elaboration Verification top, by default the view is sorted alphabetically. Use the toolbar button to Sort by address.
Tasks View
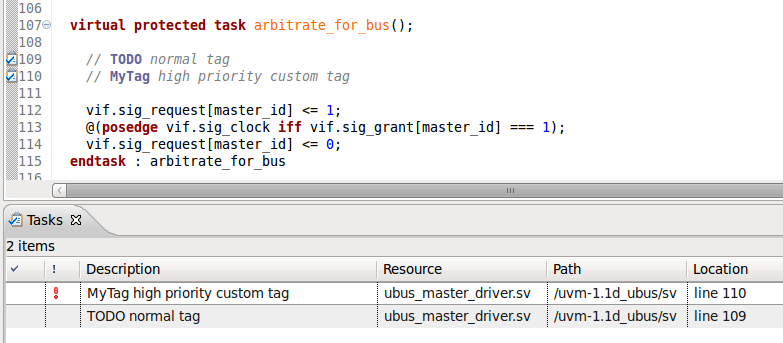
You can embed reminders in your source files by adding comments prefixed by certain “keywords” called task tags.
There are three predefined tags:
FIXME - high priority
TODO - normal priority
XXX - low priority
All reminders are listed in the Tasks View. If it is not visible, open the view from menu .
Double click on a task to jump to the marker definition.
You can define custom reminder tags and assign them priorities:
Navigate to
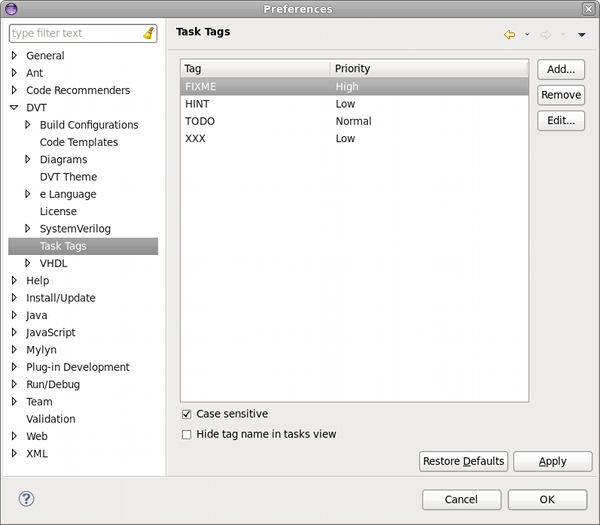
You can specify if the tags should be considered case-sensitive and if the tag name should be displayed in Tasks View.
Click the Add… button on the right, enter the name of your tag and select its priority
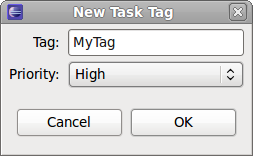
Click OK in the New Task Tag and Preferences dialogs
DVT will recognize the new tag and highlight it in code comments.
Note
it is recommended to rebuild the project so that DVT rescans all files for reminders.
Trace Connections View
The Trace Connections View presents a hierarchy similar with the Design Hierarchy View:
The connected instances are displayed, the rest are filtered out.
You can use Show Root and Show Full Hierarchy options to show the entire design. The connected instances are colored, the rest are grayed-out.
Port icons indicate the direction of the signal.
Sources and destinations are marked with red/green decorations.
You can search for a specific connected instance or signal with Quick Search in Views.
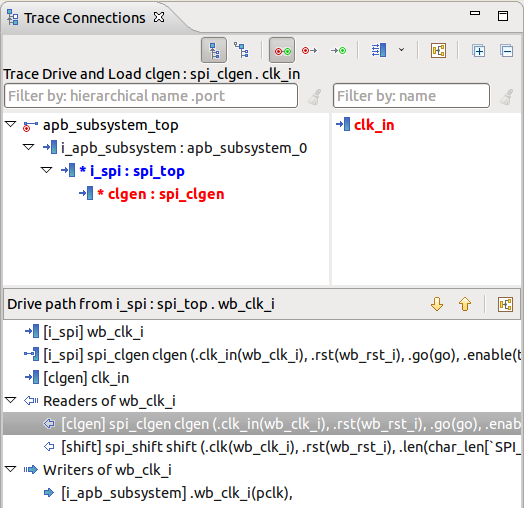
The toolbar buttons allow you to change the trace kind:
 Trace Drive and Load shows the connected instances across the drive and load paths (how is this signal connected in the design)?
 Trace Drive shows the connected instances across the drive paths (who drives this port?).
 Trace Load shows the connected instances across the load paths (who does this port drive?).
Other buttons:
 Show Root shows the path to the hierarchy root, even if the signal doesn’t reach it. It provides the enclosing context for deep traces, for example when tracing a signal many levels below the top module. This option is enabled by default.
 Show Full Hierarchy shows the full hierarchy, whether it is reached by the traced signal or not (how is this signal connected in the whole design context?).
 Show As List to view only the sources and destinations as a list.
 Show/Hide Signals shows or hides the ports or internal signals of the currently selected instance.
 Show Diagram to view a graphical representation of signal traces.
At any time you can see the traced signal (the port or internal signal you are currently tracing). It is indicated in the info label. The two connected instances that are bold colored in the tree represent:
The instance with the traced signal.
The instance with the signal shown in the trace path. More details Trace Path.
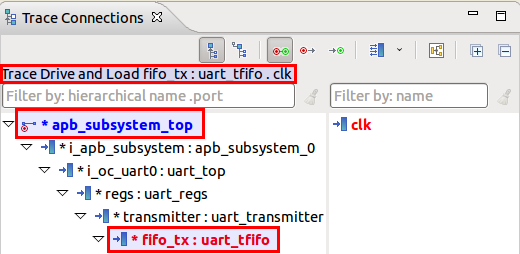
Double-click on an element to go to code:
For a connected instance, go to its declaration.
For a port, go to where it is connected in the trace path.
For a signal, go to where it is declared.
When the signals panel is hidden, right-click on an instance in the tree to show the context menu.
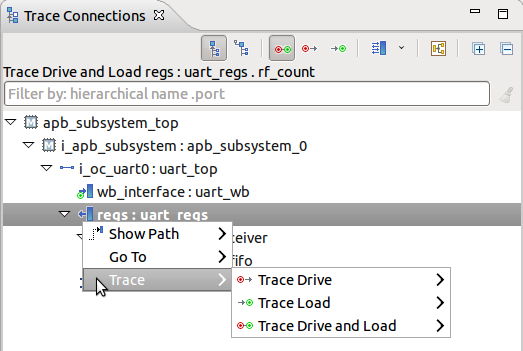
When visible, right-clicking on a port or internal signal to show the context menu.
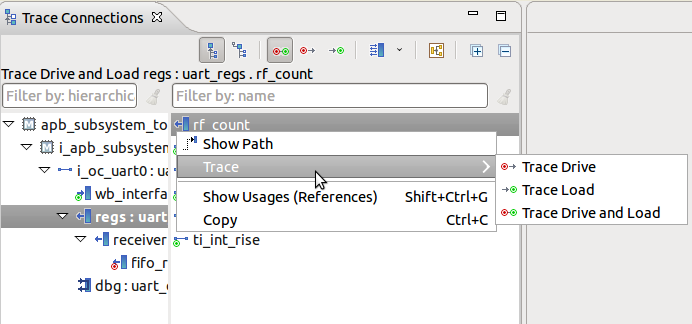
The options in the context menu are :
Trace > trace kind Trace signals found on the drive or load paths of the current traced signal.
Go to Go to the port connections or signal declarations of the selected instance. The same as double-clicking on a particular signal in the signals panel.
Show Path Show the trace path from the traced port to the selected port or internal signal. More details Trace Path.
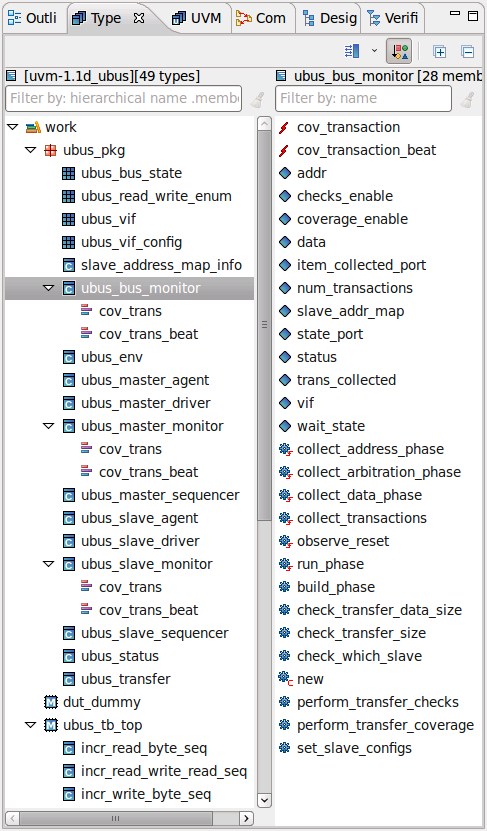
Types View
The Types View presents all the types (classes, structs, units, entities etc.) defined in your project.
Open the view from menu Window > Show View > Other… > DVT > Types.
Click on the Show Members button to show the Members pane.
Double click on a type or type member to jump to its definition.
Right click on a type or type member to search for Show Usages, Readers or Writers or further inspect the Type Hierarchy View or the Verification Hierarchy View, where applicable.
You can perform Search for Members.
Toolbar |
||
|---|---|---|

|
Show/Hide Members |
Toggles the visibility of the members pane. Use the drop-down to chose placement (to the right side or below the types tree). |

|
Sort by Category |
Click to sort by category. Default sort order is alphabetical. |

|
Expand All |
Expand all nodes in types tree. |

|
Collapse All |
Collapse all nodes in types tree. |
Note
Type containers are also shown in the view, for example libraries, generate statements, etc. See this for more information on Types, Type Containers and Type Members.
Quick Types View
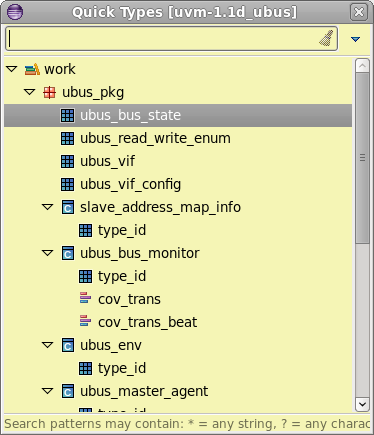
Press Ctrl+Shift+T to quickly open a specific type definition for the project associated with the active editor or the current selected project from the Navigator (if no editor is open).
The Quick Types View will pop-up and and present a filterable list of all the types in the project associated with the active editor or the current selected project from the Navigator (if no editor is open).
You can use CamelCase or Simple Regex to locate a specific element.
Select and press Enter or click to jump to its definition.
Type Hierarchy View
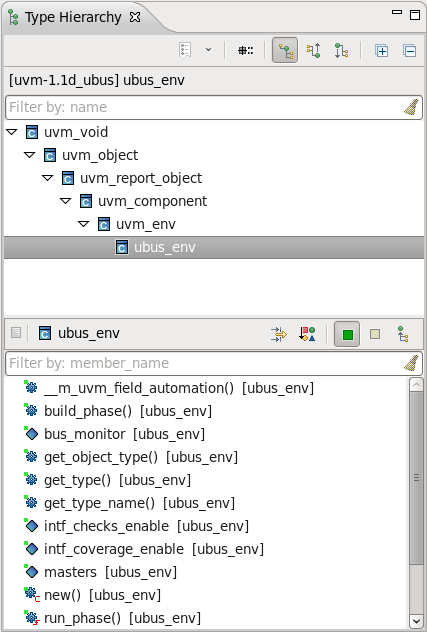
The Type Hierarchy View presents the inheritance and the members of a class or interface class.
Place the editor cursor on a class name, right-click and select or press F4.
Select a class in the inheritance tree to view its members.
Tip
To further inspect the Type Hierarchy or see Usages of a class, right-click in the inheritance tree.
Tip
Right-click on a function or task member to override it. More details here: Override Functions
Tip
You can use CamelCase or Simple Regex to find a specific element.
Hierarchy Toolbar |
||
|---|---|---|

|
Show History List |
See the previously inspected types. |

|
Prepend Package Name |
Prepend the enclosing package name to the name of each class. |

|
Show Full Type Hierarchy |
For a class, shows the super-classes and sub-classes. For an interface, shows the sub-classes and sub-interfaces (like Show Subtype Hierarchy). |

|
Show Supertype Hierarchy |
For both classes and interfaces, shows the super-classes and super-interfaces, with the selected class or interface at the root of the tree (the tree is “upside-down”). |

|
Show Subtype Hierarchy |
For a class, shows the sub-classes.For an interface, shows the sub-classes and sub-interfaces. |
Members Toolbar |
||
|---|---|---|

|
Filters |
Select what members to show (functions, tasks, fields, events etc.) |

|
Sort Members by Category |
Sort by category, otherwise alphabetically. |

|
Show Only Public Members |
Hide local and protected members. |

|
Show All Predefined Members |
Show predefined members like pre_randomize() even if not explicitly overridden. |

|
Show All Inherited Members |
Show members inherited from super-classes and super-interfaces. |
Quick Type Hierarchy View
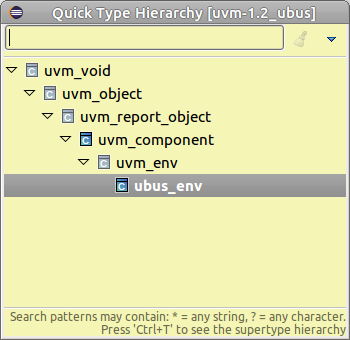
You can quickly inspect and jump to a specific parent or child in the hierarchy. Press Ctrl+T with the cursor positioned on the element name.
The Quick Type Hierarchy View will pop-up and present a filterable list with all of the selected element’s hierarchy.
You can use CamelCase or Simple Regex to locate a specific element.
Select and press Enter or click to jump to the corresponding source location.
Tip
While the Quick Type Hierarchy View is open you can press Ctrl+T to switch between Full type and Supertype hierarchy.
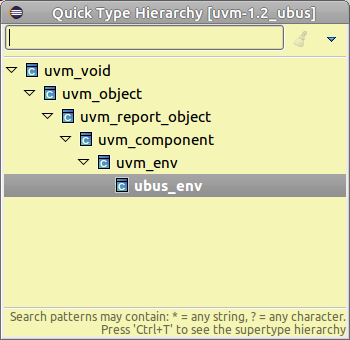
For functions, you can also see the implementations along the hierarchy (icons are not grayed).
UVM Browser View
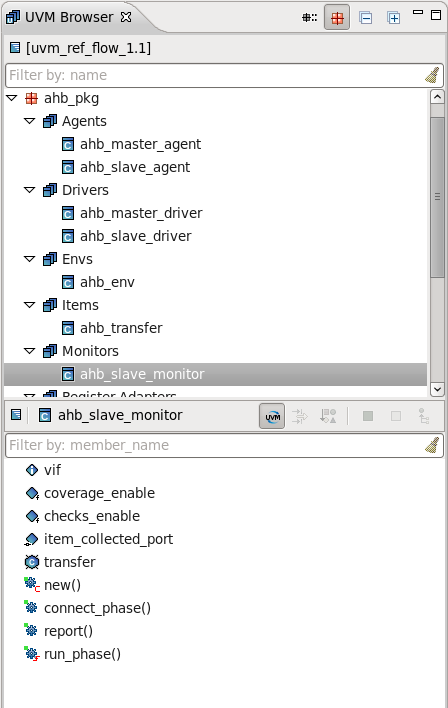
The UVM Browser View is an intuitive entry point for exploring all the classes of a UVM-based verification environment.
It allows you to explore UVM-based classes grouped by categories, like agents, monitors, drivers or sequences and easily inspect the UVM flow specific API, like overridden phases, class members registered to the factory or TLM ports.
Open the view from menu .
You can use CamelCase or Simple Regex to locate a specific element.
Toolbar |
||
|---|---|---|

|
Prepend Package Name |
Prepend the enclosing package name to the name of each class, useful when you explore for example all agents across packages. |

|
Group By Package |
Group classes by package. You may chose to see for example all agents across packages or to explore all categories in a specific package. |
The top UVM Types Panel presents all the UVM-based classes defined in your verification environment. For convenience they are grouped by categories like agents or monitors.
The inheritance hierarchy between classes is shown up to the UVM base class.
The categories and their corresponding base classes are the following
Categories |
Base class |
Notes |
|---|---|---|
Agents |
uvm_agent |
|
Drivers |
uvm_driver |
|
Envs |
uvm_env |
|
Items |
uvm_sequence_item |
|
Monitors |
uvm_monitor |
|
Memories |
uvm_mem |
|
Other Components |
uvm_component |
Any class deriving from uvm_component which does not fall into any other category within this table. |
Other Objects |
uvm_object |
|
Ports |
uvm_port_base, uvm_tlm_if_base, uvm_tlm_extension_base, uvm_sqr_if_base, uvm_tlm_req_rsp_channel, uvm_tlm_fifo_base |
|
Registers |
uvm_reg |
|
Backdoor Registers |
uvm_reg_backdoor |
|
Frontdoor Registers |
uvm_reg_frontdoor |
|
Register Adapters |
uvm_reg_adapter |
|
Register Blocks |
uvm_reg_block |
|
Register Fields |
uvm_reg_field |
|
Register Sequences |
uvm_reg_sequence |
|
FIFO Registers |
uvm_reg_fifo |
|
Register Files |
uvm_reg_file |
|
Register Maps |
uvm_reg_map |
|
Register Predictors |
uvm_reg_predictor |
|
Scoreboards |
uvm_scoreboard |
|
Sequencers |
uvm_sequencer |
|
Sequences |
uvm_sequence |
|
Tests |
uvm_test |
The bottom Members Panel panel displays class members. You can toggle the UVM Members Mode on/off using the  button.
In UVM Members Mode it displays the following members:
Virtual interfaces
Class members registered to the factory using the `uvm_field… macros
Class members of an UVM-based type (TLM ports included)
Overridden functions and tasks from parent UVM base classes
When the UVM Members Mode is off, the Members Panel behaves exactly like the Members Panel of the Type Hierarchy View.
UVM Sequence Tree View
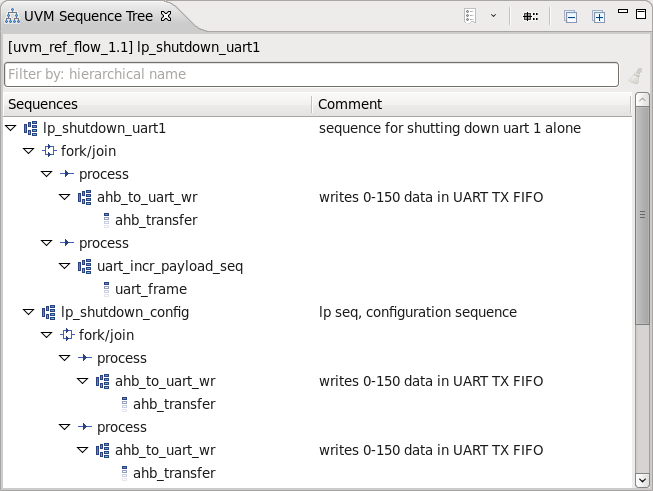
The UVM Sequence Tree View presents the call tree of an UVM sequence. The call tree is made of all sub-sequences that are triggered by the sequence, recursively down to leaf sequence items.
To select a sequence and inspect its call tree, position the cursor on the UVM sequence class name in the editor and:
press Ctrl+Alt+Shift+S
or right click and choose from the menu.
The UVM Sequence Tree view is automatically raised and populated with the call tree of the selected sequence.
At any time you can open the view from .
Toolbar |
||
|---|---|---|

|
Show History List |
Click to see the previously inspected UVM sequence call trees. |

|
Prepend Package Name |
Prepend the enclosing package name to the name of each class. |
The view label shows the current project and the sequence for which the call tree is presented.
The sequence call tree has the following node types:

|
A class that inherits from uvm_sequence. A sub-sequence may be called from an `uvm_do macro or started using the seq.start() function. |

|
A class that inherits from uvm_sequence_item. |

|
A fork/join block in the sequence body(). |

|
A process from a fork/join block. |

Right-click on a sequence node in the tree and you have the following options :
Show Usages (References) Search for the references of the selected sequence. More details Show Usages, Readers or Writers.
Show Type Hierarchy Show the type hierarchy for the selected sequence. More details Type Hierarchy View.
Show Verification Hierarchy Show the verification hierarchy for the selected sequence. More details Verification Hierarchy View.
Show UVM Sequence Tree Show the sequence tree for the selected sequence. Practically set the selected sequence as root.
Show Diagram Show the diagram for the selected sequence. More details Diagrams.
Copy Copy the selected sequence class name to clipboard.
Verification Hierarchy View
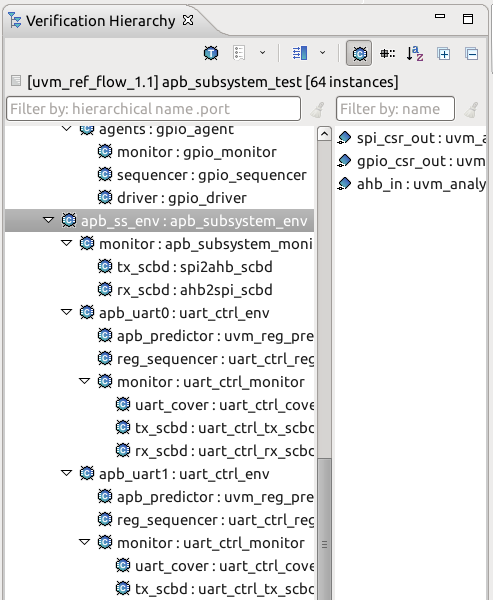
The Verification Hierarchy View presents the UVM object instance tree. An UVM object instance is a class member of an UVM based type that is created using an UVM factory create call.
To populate the view, go to the UVM menu and Select Verification Top or use the view toolbar button.
For the selected UVM test, you have the option to view a statically elaborated hierarchy or perform a UVM Runtime Elaboration in order to view testbench structures accurately reflecting the configuration at start of simulation.
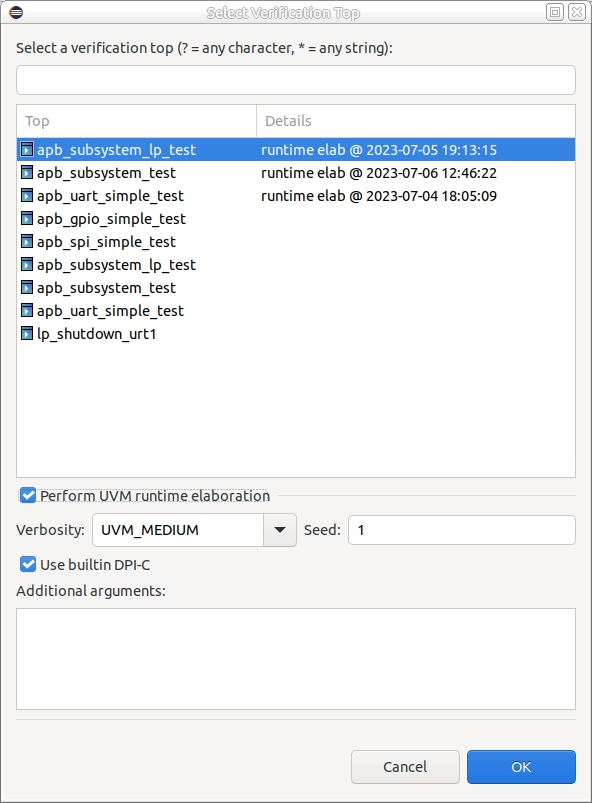
 Select Verification Top select a UVM test.
 History List Click to see the previously inspected components.
 Show/Hide Ports Shows or hides the UVM ports of the selected component. You can set the ports panel to the right or below the hierarchy.
 Show only UVM Components Show only UVM component instances in the hierarchy. By default it is on which means that the UVM object instances instantiated using create are not shown.
 Prepend Package Name Prepend the enclosing package name to the name of each class, useful when you explore for example all agents across packages.
 Alphabetical Sort Sort instances and ports alphabetically. By default it is off which means that the instances and the ports are presented in their declaration order from the source files.
The view label shows the current project, the current top component and the number of instances in the hierarchy.
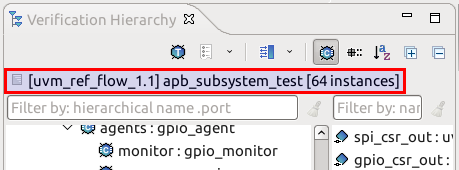
You can double-click on any component to go to its UVM factory create call.
Right-click on an instance in the hierarchy and you have the following options :
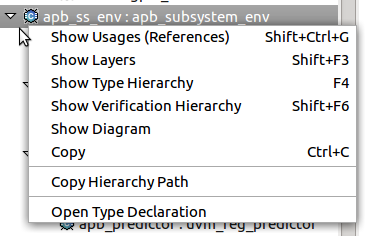
Show Usages (References) Search for the references of the selected instance. More details Show Usages, Readers or Writers
Show Layers Show the layers of the selected instance. More details Layers View.
Show Type Hierarchy Show the type hierarchy for the selected instance type. More details Type Hierarchy View.
Show Verification Hierarchy Set the selected instance as the top of the hierarchy and update the view.
Show Diagram Generate the UVM Component Diagram of the selected instance. More details UVM Components Diagrams.
Copy Copy the label text of the selected instance to clipboard.
Copy Hierarchy Path Copy the hierarchy path of the selected instance to clipboard. You can change the segment separator from Window > Preferences > DVT.
Open Type Declaration Go to the component declaration of the selected instance.
You can double-click on any port to go to its declaration.
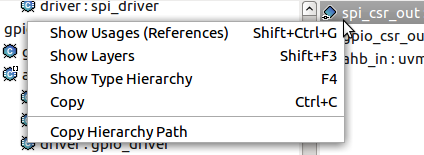
Right-click on a port and you have the options to search for its usages, its layers and for its type hierarchy, also you can copy its name and the full hierarchy path of the selected port.
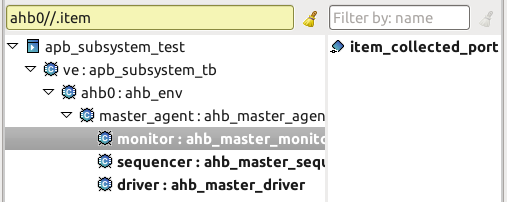
You can use the filters to locate a specific instance or port. You may use slash ‘/’ characters to filter hierarchically one level and ‘//’ to filter hierarchically all the levels. You may use the dot ‘.’ character to filter instances that contain a specific port. See Quick Search in Views for more details.
For example, filtering hierarchically all the levels for a specific port name :
