Tips and Tricks
The following tips and tricks give some helpful ideas for increasing your productivity.
Editing
Content assist |
Content assist provides you with a list of suggested completions for partially entered text. In the editor press Ctrl+Space. 
|
Module Automatic Instantiation |
You need to type the first letters of the module name, then press Ctrl+Space three (3) times.You can recognize module instances by their icon, it looks like a chip with ports ready to be glued in. 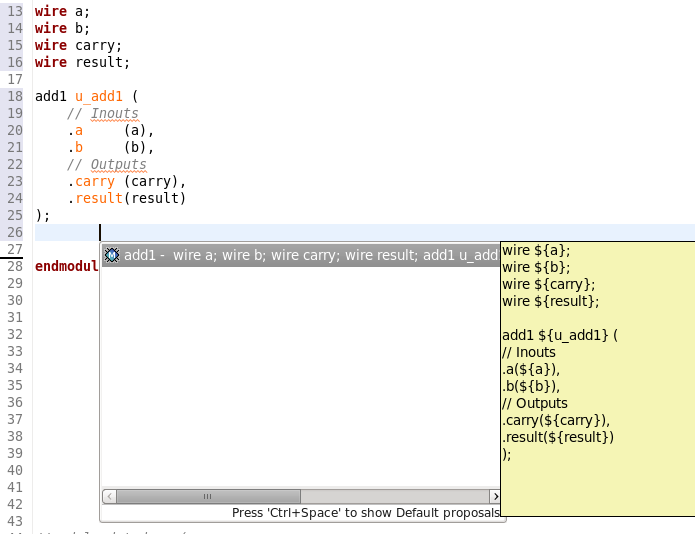
|
Expand Macros (Apply Preprocessing) |
You can apply preprocessing over a selected section of code in order to see how macros are expanded. You have multiple options in the right-click context menu Macros. To expand them in the source file, choose Expand One Level Inline or Expand All Levels Inline. 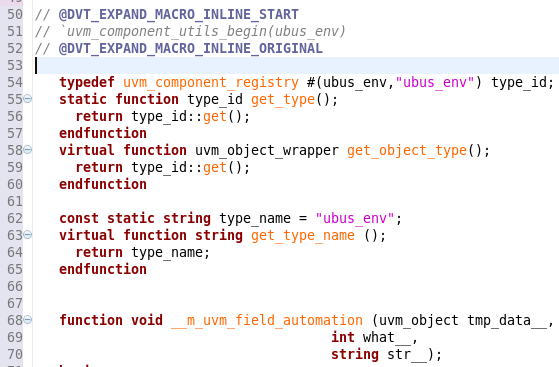
To expand them in a temporary file, choose Expand One Level or Expand All Levels. 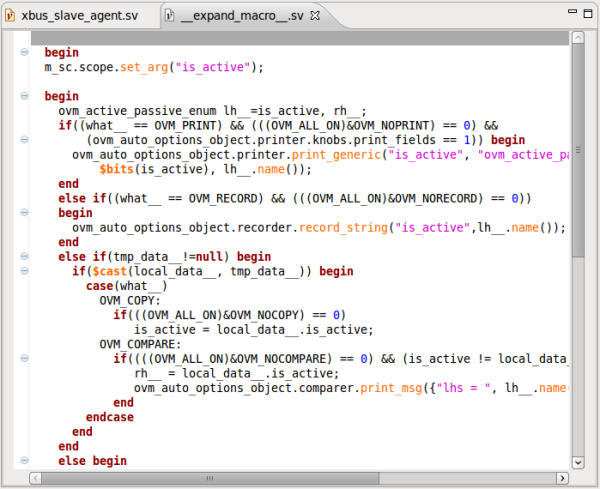
Note You can also expand all macros in the current file by selecting either Expand All Macros Inline, for expansion in the source file, or Expand All Macros, for expansion in a temporary file. |
Trace Macro Errors |
To debug macro usage errors (especially if macros in macros are used) you can see how the error is propagated from macro to macro (the error trace) either by:
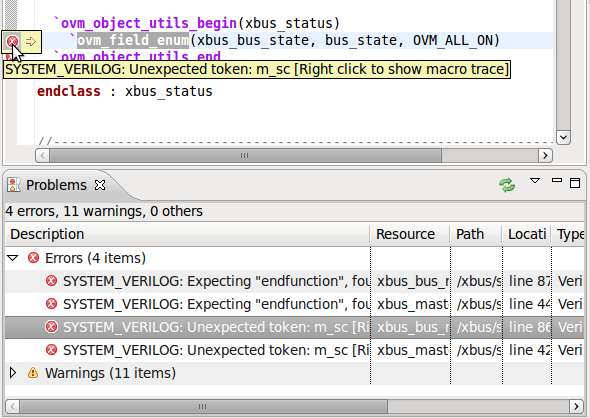
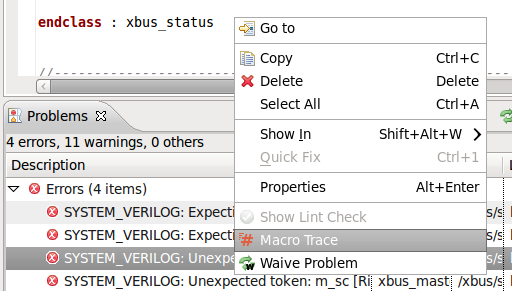
The macro error trace will be presented in the Console View with hyperlinks to source. 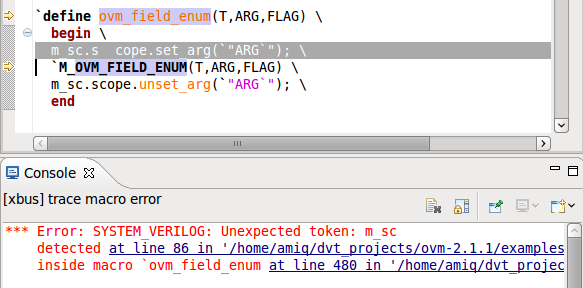
|
Code templates |
Code templates are presented in content assist if applicable. 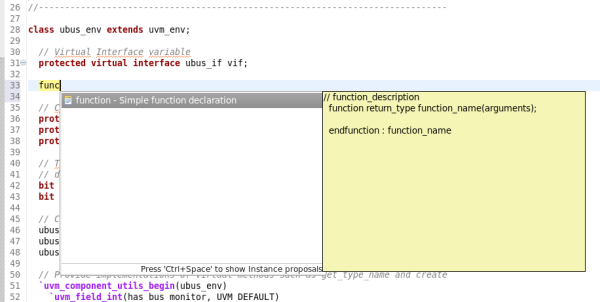
|
Matching begin - end |
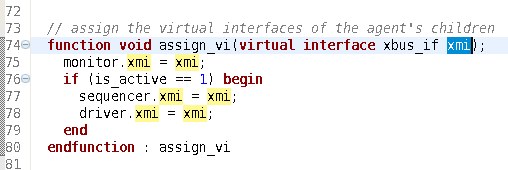
If you double click on/after begin – end, function – endfunction etc. the block is highlighted. 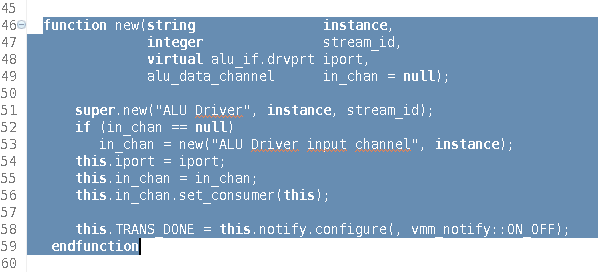
|
Mismatched endif |
You can use comments after endif to track the match with starting ifdef. If the name of ifdef doesn’t match the endif comment a warning is issued. 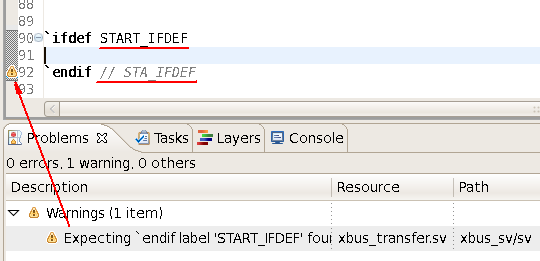
|
Toggle Comment |
You can toggle comment on/off for the current line or the selected lines. Press Ctrl+/ or use the action from the drop down menu on right click in editor. 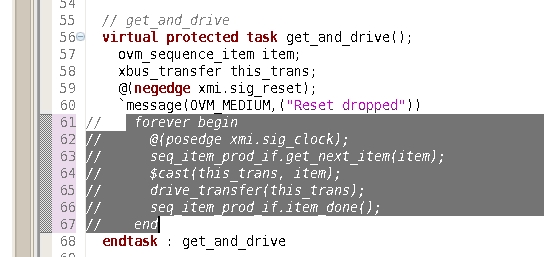
|
Expand/Restore Selection |
Press Shift+Alt+Up Arrow to incrementally expand the current selection. For example when the cursor is on a word, select the word. Press again to select the whole line. Then, each of the nested enclosing scopes is selected, for example |
Format source |
Use the action from the editor’s right click menu. The whole file is formatted or the current selection, if any. |
Override functions |
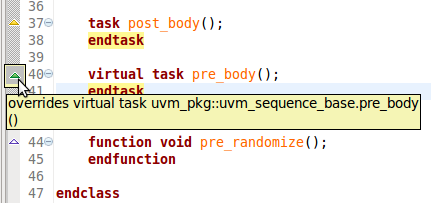
To access the Override menu, in Editor, right click inside a class body > Source > Override Methods. |
One key indentation |
If you press Tab once at the beginning of a line, it is automatically aligned to the enclosing context. Press twice to insert a tab. |
Reminders (TODO markers) |
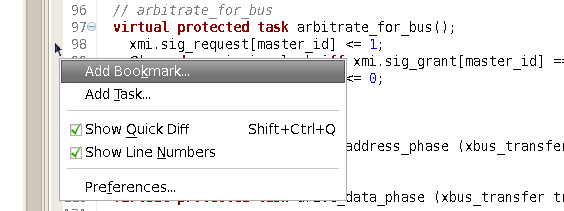
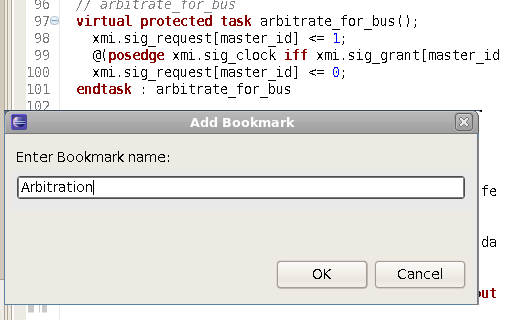
When you tag a comment in source code with TODO, a corresponding tasks is automatically created as a reminder. From the Tasks View, double click on the task takes you to the TODO in the code. Same for for FIXME (higher priority) and XXX (lower priority) markers. You can also add your own tags, see the Reminders (TODO Markers) section of the documentation. 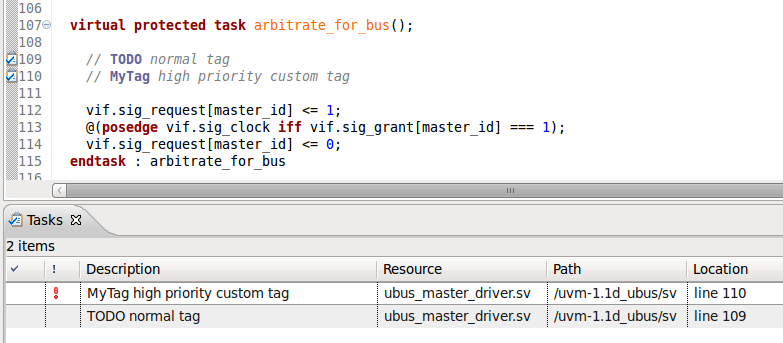
|
Spell checking |
You can enable spell-checking support from the preference page. Spelling errors are displayed in the Verilog Language editor and corresponding Quick Fixes are available. 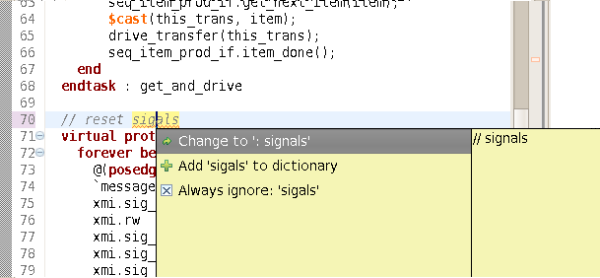
|
Folding |
You can fold code sections to improve read-ability. This is how a folded file looks like: 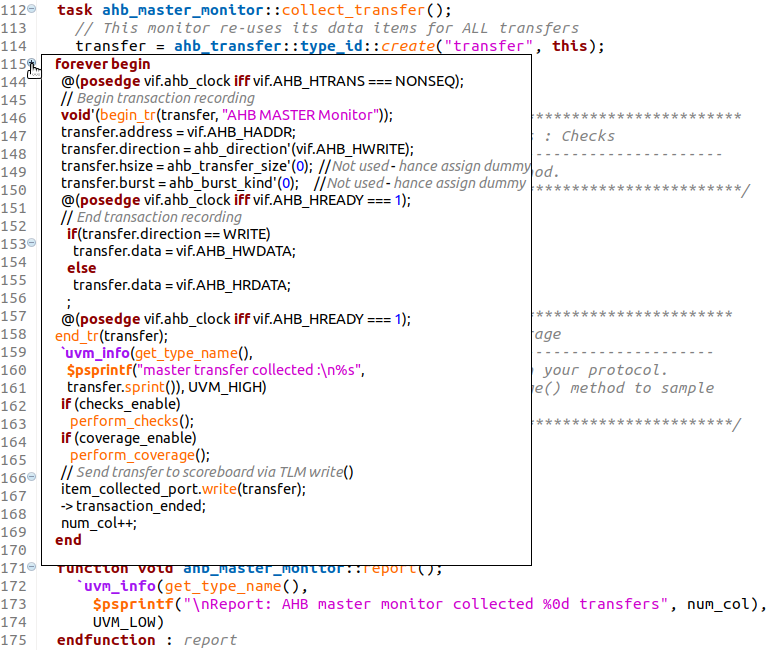
Folding actions (to expand or collapse) are available in the toolbar 
or on right click in the editor. You may also use the + or - signs on the left side of the editor.
When you type on a folded line, it is automatically expanded. You may see the folded code in a tooltip if you move with the mouse over the + sign. |
Folding custom areas |
You can define custom folding areas using comments to indicate the start and the end of the area: 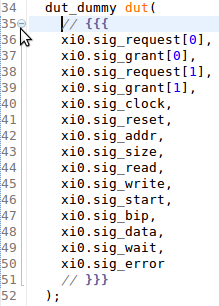
|
Maximize editor |
Double-click on the editor tab to maximize editor to full window. Double-click again to restore. |
Show line numbers |
Check Show line numbers from the preference page |
Local history |
Whenever you edit a file, its previous contents are kept in the local history. Right click in the editor and choose 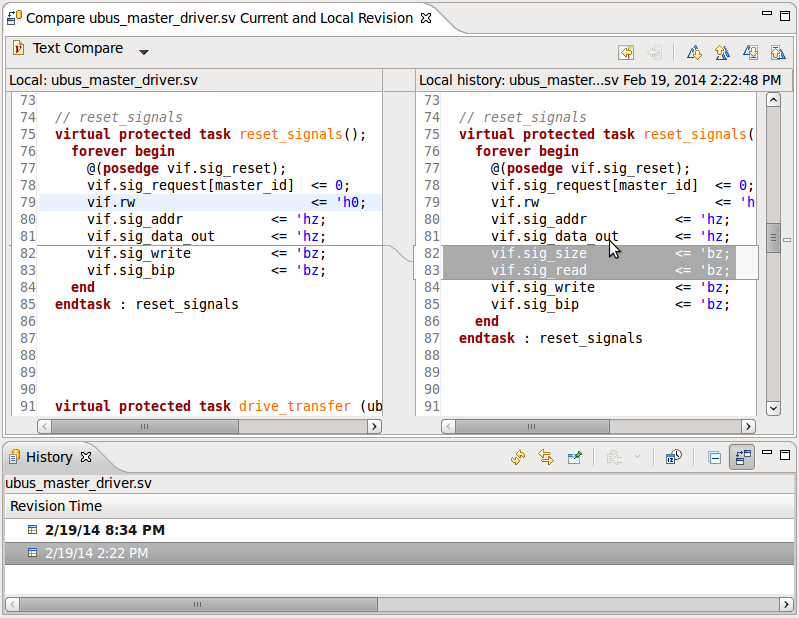
|
Inactive code highlight |
The editor marks with a colored background the areas of code that are not compiled due to preprocessing. See the Inactive Code Highlight documentation section. 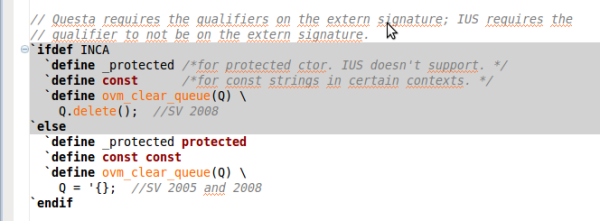
|
Emacs Automation |
You can invoke Emacs to perform automation on the file you are currently editing. In the editor window: Right click > Source > Emacs, then select one of: Auto, DeleteAuto, InjectAuto, Indent or use the associated key bindings (the same as in Emacs). Note The shortcuts are available only when Emacs mode is enabled in Eclipse; to enable Emacs mode go to and select the Emacs scheme. Note You can also add toolbar buttons to perform Emacs automation: go to and check Emacs Verilog-Mode from the Available command groups on the left. Note To change the default emacs command go to and fill in the Emacs command you want to execute. |
Open file in more editors |
To open multiple editors for the same file you should first open the file then right click on the editor’s titlebar and select New Editor 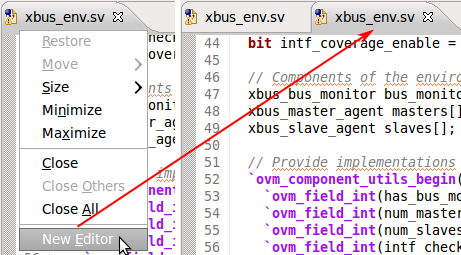
|
Split the editor view |
To open multiple editors side by side follow these steps:
|
Column selection |
You can switch to and from column (block) selection mode either by clicking on the “Toggle Block Selection Mode” button in the toolbar, or by using the Shift+Alt+A shortcut key. 
|
Auto insert JavaDoc comment |
To add JavaDoc like comments to code, in Code Editor type above the code declaration /** and then press Enter. Depending on the code type (a class declaration, a function, a task etc.) a comment will be added with the respective JavaDoc tags. For more details: Export HTML/PDF Documentation 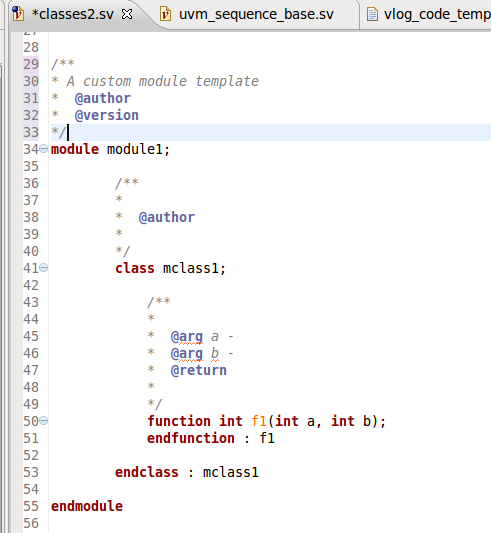
|
Searching
Search for task. function, field etc. |
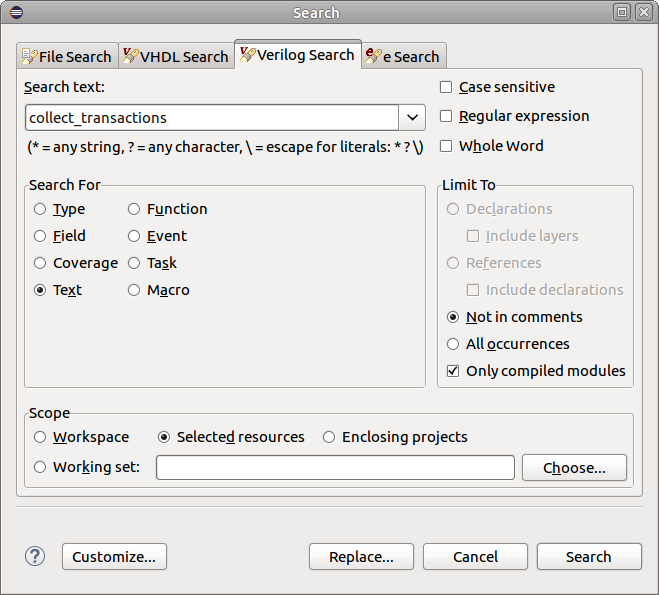
To search for the declaration of a specific type, method, field etc.:
|
Search for references |
To search where a method (or field etc.) is used, hold Ctrl, hover over its name and select Show Usages or right click on its name > Show > Usages or right click on its name > References > Project. The results are presented in the Search View. You can also search for references from the Search Dialog (Ctrl+H). 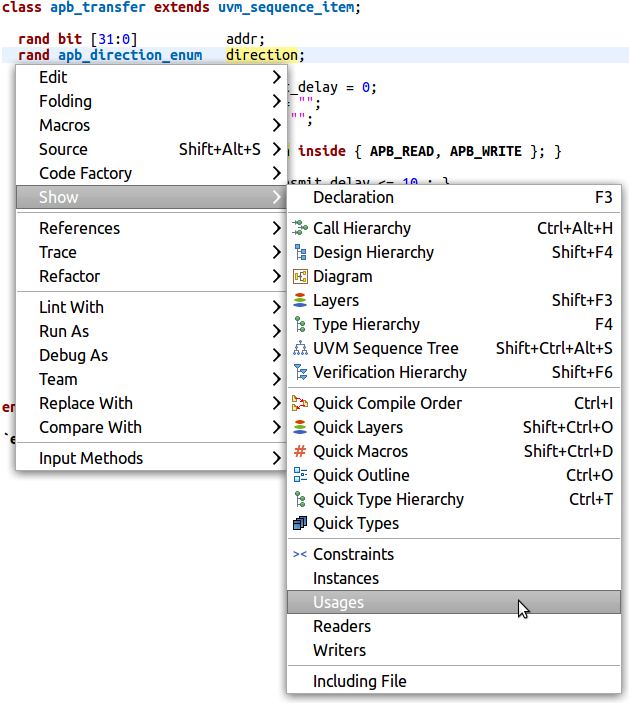
|
Search for whole word |
To search for a whole word in all files, in comments or not:
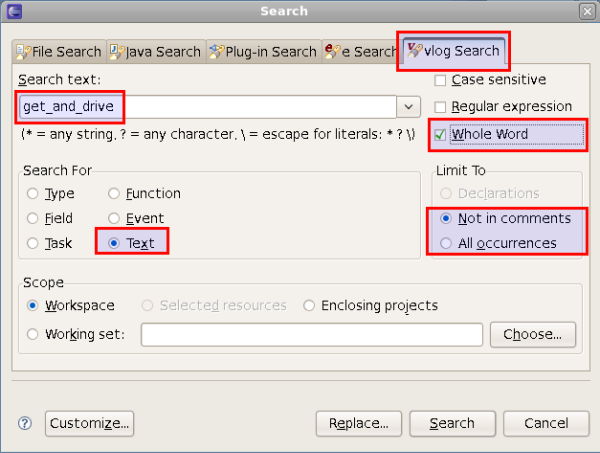
|
Miscellaneous
All shortcuts |
Press Ctrl+Shift+L to see all shortcuts. 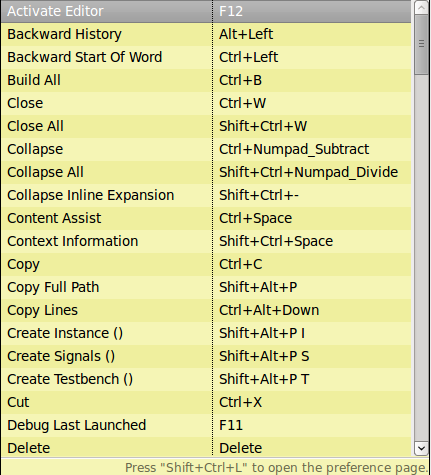
|
Project Properties |
Select the project in the Navigator View, right click and choose Properties. Or from menu . |
OVM Field Editor |
The OVM Field Editor enables you to inspect and edit OVM field registrations. To bring up the OVM Field Editor, right click inside a class definition and select OVM Field Editor from the pop-up menu, or simply press Shift+Alt+F. 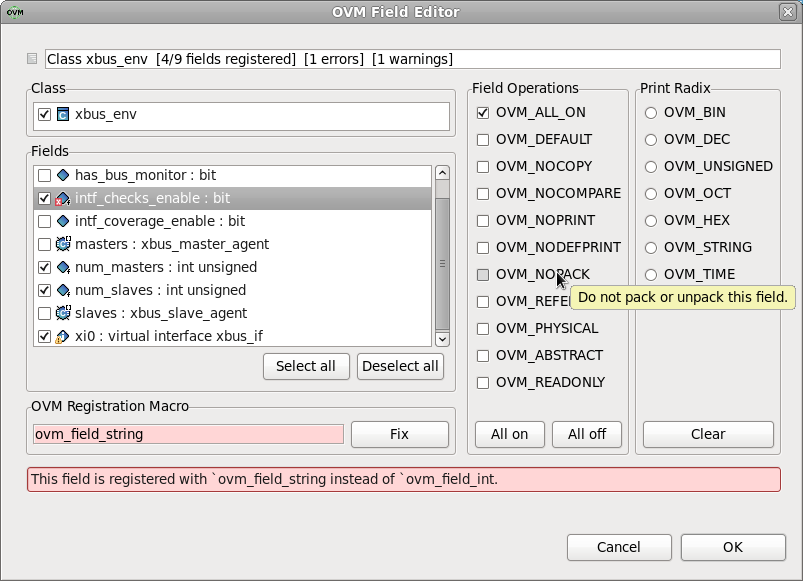
|
UVM Field Editor |
The UVM Field Editor enables you to inspect and edit UVM field registrations. To bring up the UVM Field Editor, right click inside a class definition and select UVM Field Editor from the pop-up menu, or simply press Shift+Alt+G. 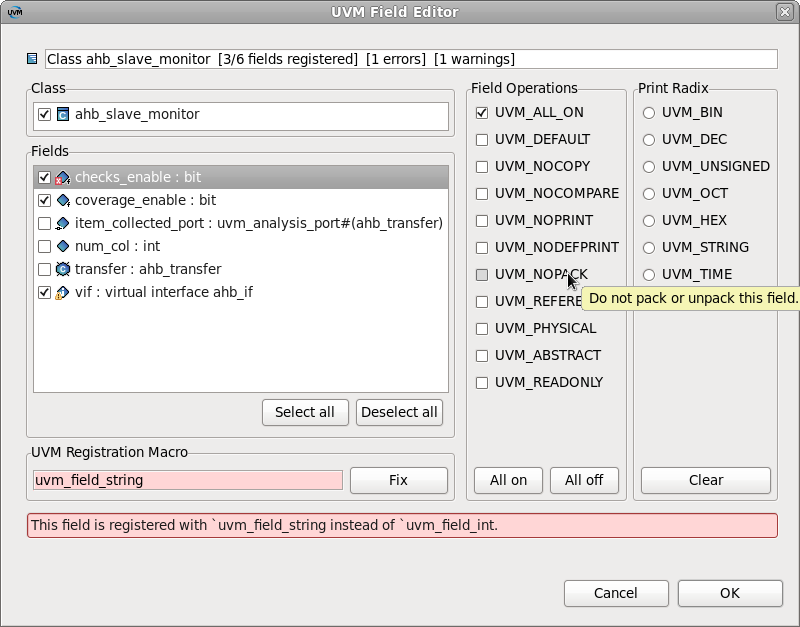
|
Project templates |
A project template is a parameterized directory tree. Both in the file contents (.v, .sv, .sh - practically any file) and in the file or directory names you can use parameters. Combined with TODO markers, you can use a project template as a customized wizard. For more details see the Project Templates chapter in VlogDT User Guide. |
System Variables and -f Support |
See: Build Configurations |
Generic launch (make, scripts etc.) |
You can launch external scripts: Menu Run > Run…. Select DVT Generic configuration and click the New button. Specify name, working directory and command. Click Run. 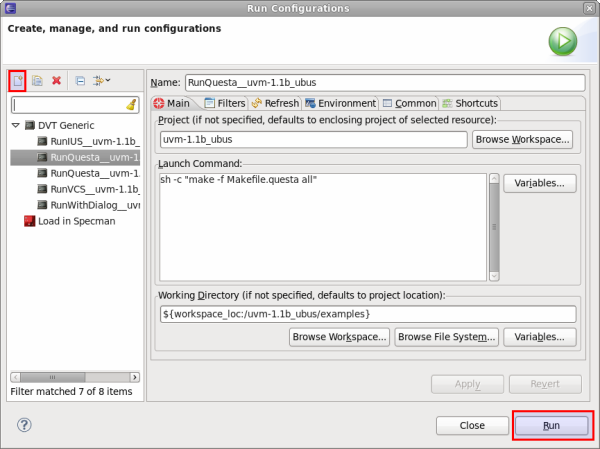
You can also use the Run > Quick Run menu (or Ctrl+U shortcut key) to quickly launch any existing Run Configuration: 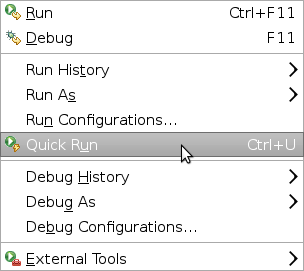
|
Create dialogs for scripts & flows |
You can create Custom Dialogs for your own scripts: 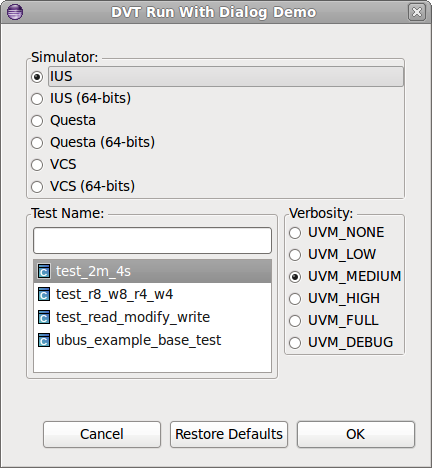
Follow the wizard from menu New > Example > DVT > DVT Custom Dialog, then create a run configuration with the command |
Open terminal |
You can open a fully working command-line terminal inside of DVT: In the Navigator View right-click on the desired location and select Open Terminal Here |
External Builders |
An external builder allows you to invoke any script/tool and back-annotate its output (errors, warnings etc.) to the source code. It is a mean that allows you to connect any 3rd party tool (compiler, linter etc.) to DVT error signaling engines. You can configure one or more external builders on a project:
|
External Documentation |
You can browse and search through 3rd party documentation using the Eclipse help system. For more details see the External Documentation chapter in VlogDT User Guide. |
Context Sensitive Help |
A focused set of help topics that is related to the current context can be shown to users on demand using context-sensitive help. This form of user assistance is delivered to users when a platform-specific trigger is activated (e.g. F1 key on Windows, Ctrl+F1 on GTK, Help key on Carbon). For more details see the Context Sensitive Help chapter in VlogDT User Guide. 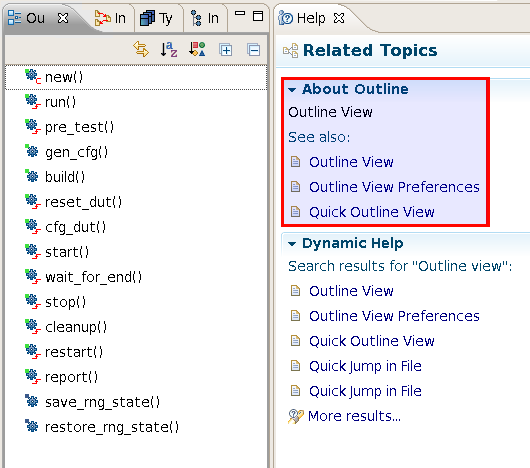
|
Mapping Linux to Windows |
Linux directories can be mapped to Windows drives, thus allowing editing files from Windows. For example /home/simi is mapped to Z:. This has an impact on paths configured for a DVT project, for example INCDIRs etc. The paths are set using Linux conventions, however Eclipse runs in Windows and the DVT builder needs to know about the mapping in order to compile the files. To specify the mapping, set the system variable %DVT_CROSSPLATFORM_MAP% before invoking Eclipse. You can add multiple mappings separated by “;” e.g.: /projects/=p:;/home/lars/=Z:lars |
Recover from abnormal inconsistencies |
In the event of unexpected behavior (missing results in search, types in type browsing, hyperlinks, tooltips etc.) please manually trigger a clean build from menu Project > Clean…. |
OVM Smart Log |
DVT ships with predefined filters for OVM that allow you to view colored and hyper-linked logs like the one below: 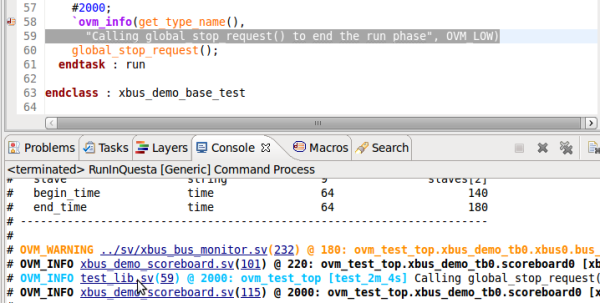
See OVM Smart Log for more details. |
UVM Smart Log |
DVT ships with predefined filters for UVM that allow you to view colored and hyper-linked logs like the one below: 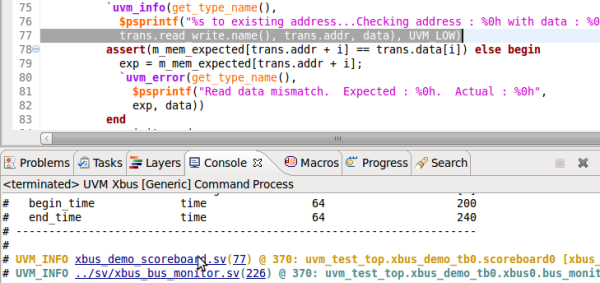
See UVM Smart Log for more details. |
OVM to UVM Migration |
DVT provides an OVM to UVM migration wizard that automatically performs all the necessary changes within an existing OVM project. To start the wizard: right click on a project/file/directory in the navigator, then select Refactor > Migrate OVM to UVM. See OVM to UVM Migration documentation page for more details. |
Add a new file extension to compile list extensions |
Go to Window > Preferences > General > Content Types, select a category from the list (for example Verilog Source File) then click on Add and then on Ok. 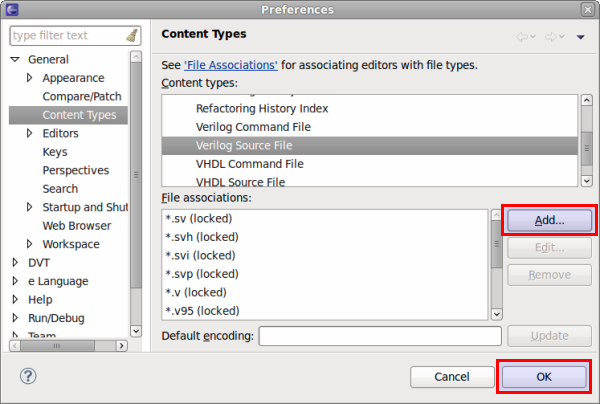
|
Sharing workspace settings |
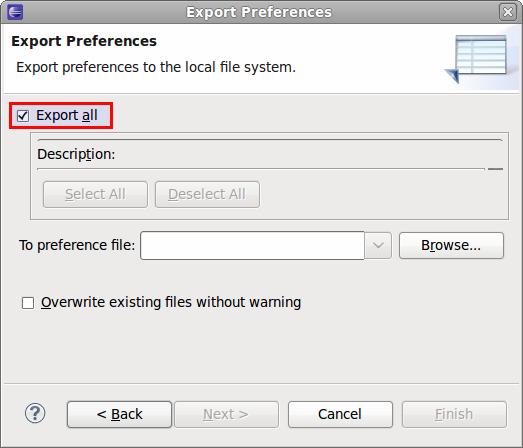
Export all Workspace/ Eclipse customization: - Go to File > Export > General > Preferences - Make sure Export all is selected - Select a file where the preferences should be exported Now you can share this file with your team. When it is imported into another instance of Eclipse (by using File > Import > General > Preferences), the configuration (all options available in Window > Preferences) is replaced by the imported one. Note: you should restart Eclipse for the changes to be enforced (File > Restart). 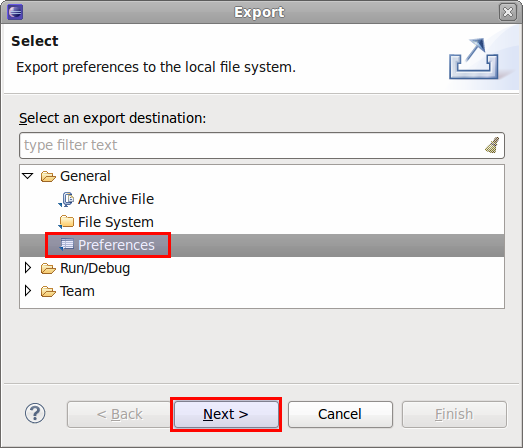
|
Using System Variables in Linked Resources |
You can use System Variables in the path of linked resources. For example ${DVT_ENV-SYSTEM_VARIABLE_NAME}/work is equivalent to $SYSTEM_VARIABLE_NAME/work in a console. |
Waive problems reported by DVT |
You can use Compile Waivers to promote, demote or disable the problems reported by DVT. To quickly create a new waiver, in the Problems View right click on any problem reported by DVT and waive it. DVT proposes some default values for the waiver description, path and message. You can easily change them to fine-tune the waiver. To quickly start up a new waivers file click on the Edit waivers button in the Problems View. The .dvt/waivers.xml is created with a default content and opened. You can easily create your own waivers from the default generated ones. In the waivers editor you can use autocomplete for tags, attributes and attribute values. |
Open a file in DVT from the terminal |
You can use the Command Line Interface like this: The command can be shortened by defining this alias in your ~/.cshrc: or by defining this function in your ~/.bashrc: Then the command gets much shorter: |
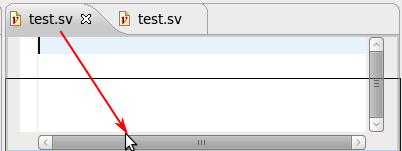
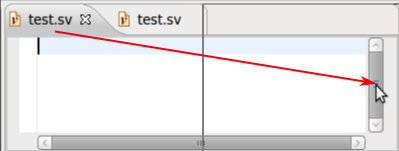

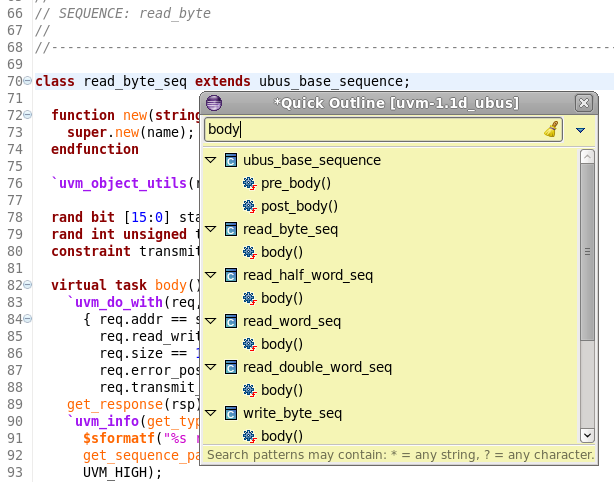
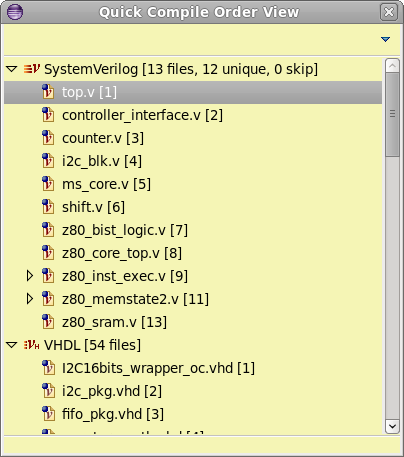
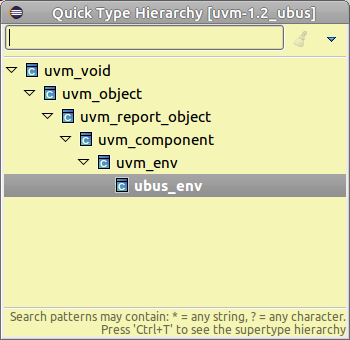
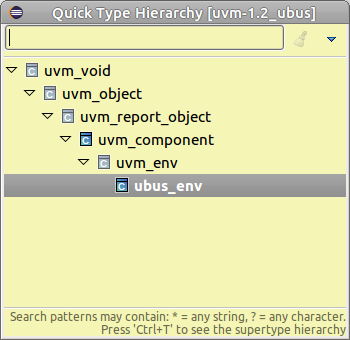
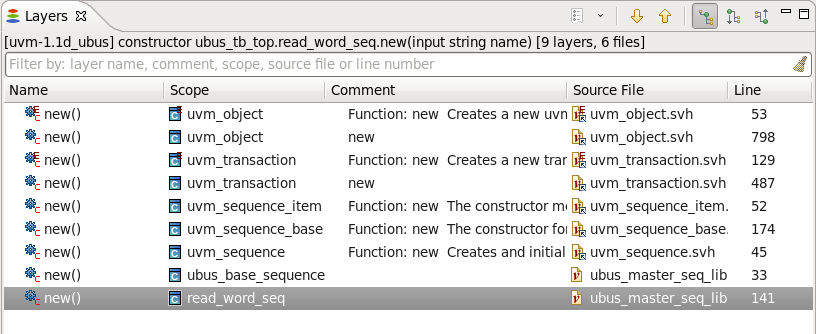
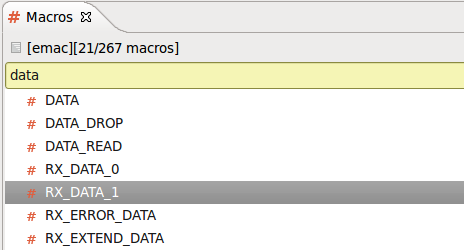
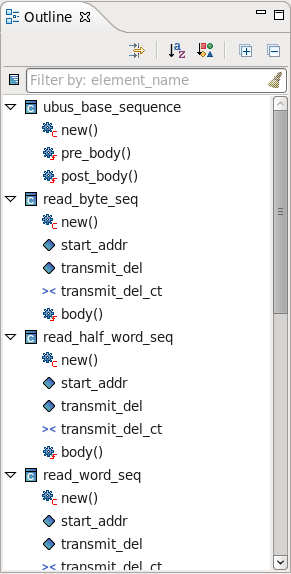
 or press Alt+Shift+O.