Waveform Viewer
Overview
You can visualize and analyze waveforms using the Waveform Viewer in the DVT IDE by opening a VCD (Value-Change Dump) file.
Simply Double click any *.vcd file in the Project Explorer View or browse to any location on disk from the menu.
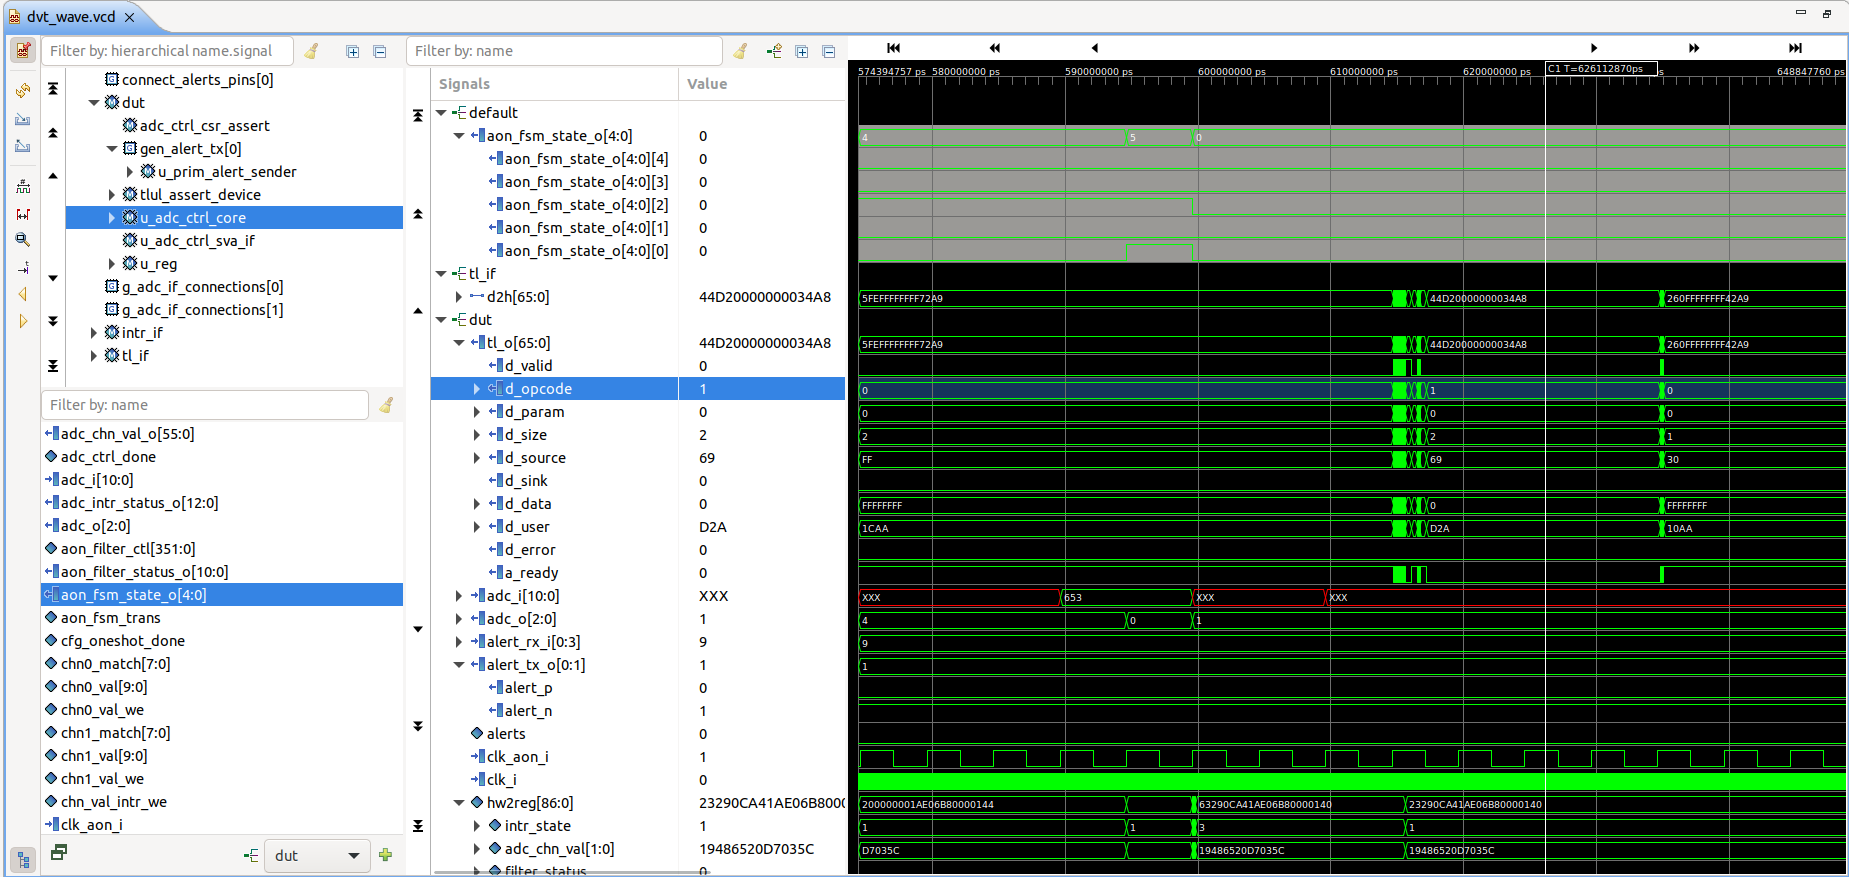
Here it is a breakdown of the user interface into its main components:
The Toolbar provides various actions and control knobs explained in detail below.
In the Design Panel you can quickly locate signals in the design and select them to be displayed in the waveform.
In the Signals Panel you can reorder signals and aggregate them into groups, inspect their values for a specific timestamp, or customize the displayed waveform color and value radix.
The Waveform Canvas displays the actual waveforms for the signals panel, lets you pan/zoom the time window and supports placing cursors and markers.
The waveform viewer seamlessly integrates with the DVT IDE allowing you to:
Add signals to the waveform directly from the editor or various structured views, such as the Design Hierarchy or Outline.
Add a signal along with all of its drivers or loads at once.
Jump to the definition of a signal in the source code directly from the Signals panel.
Inspect the values of signals in tooltips and the Inspect View, based on where the cursors are positioned in the waveform.
Toolbar
 Set current wave Sets this waveform viewer as the current one used for adding signals from editors/views, showing values in editor tooltips or the Inspect View. See IDE Integration.
 Refresh Update the waveform to reflect the latest changes to the VCD file, for example when a simulation is in progress or the file got overwritten.
 Import/export config You can export the current waveform viewer configuration to a file, either for later use or to apply it to a different waveform, for example when you are performing a comparative analysis. It includes the list of signals with their grouping as well as cursor and marker positions.
 Count edges Shows various statistics for the selected signal in the time window between the primary and secondary cursors (edge/posedge/negedge count, time high/low, duty cycle).
 Zoom to fit cursors Zoom to the time window between the primary and secondary cursors.
 Zoom to fit canvas Zoom out to show the entire contents of the VCD.
 Jump to time Show the waveform centered around the specified time. The time unit is as specified by the VCD $timescale.
 Prev / Next change Moves the primary cursor to the next / previous change of the selected signal. The displayed time window is updated to keep the cursor in view.
 Show/Hide Design panel You can hide this panel when not needed in order to maximize the area available for waveforms. For example you can rely on editor/design hierarchy context menu actions to add signals.
Design Panel
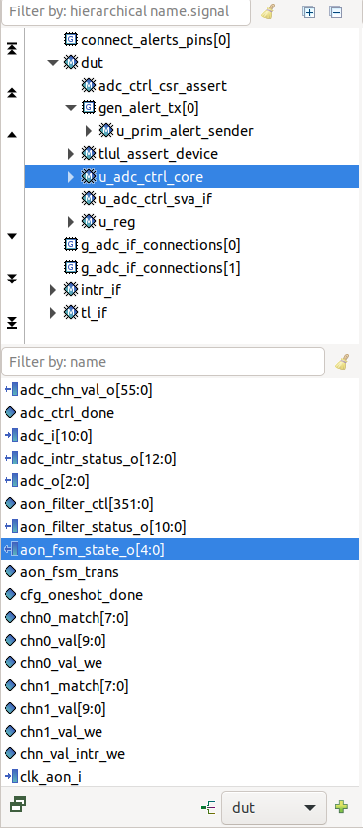
The Design Panel presents the design hierarchy as read from the VCD file in the top tree. Selecting a design instance or block reveals all its signals in the bottom list (including ports, nets, variables and parameters). See Quick Search for details on how to perform advanced filtering.
Double click a signal to add it to the Signals Panel. Double click an instance or block to add all of its signals. Alternatively, select one or more signals and click the Add Signal  button. You can optionally specify to which group the signals should be added using the drop-down selector
  .
.
Use the Show/Hide Design Panel button in the Toolbar to toggle the panel’s visibility, or click Detach  to use it as a separate floating window which you can later Reattach if needed.
Signals Panel
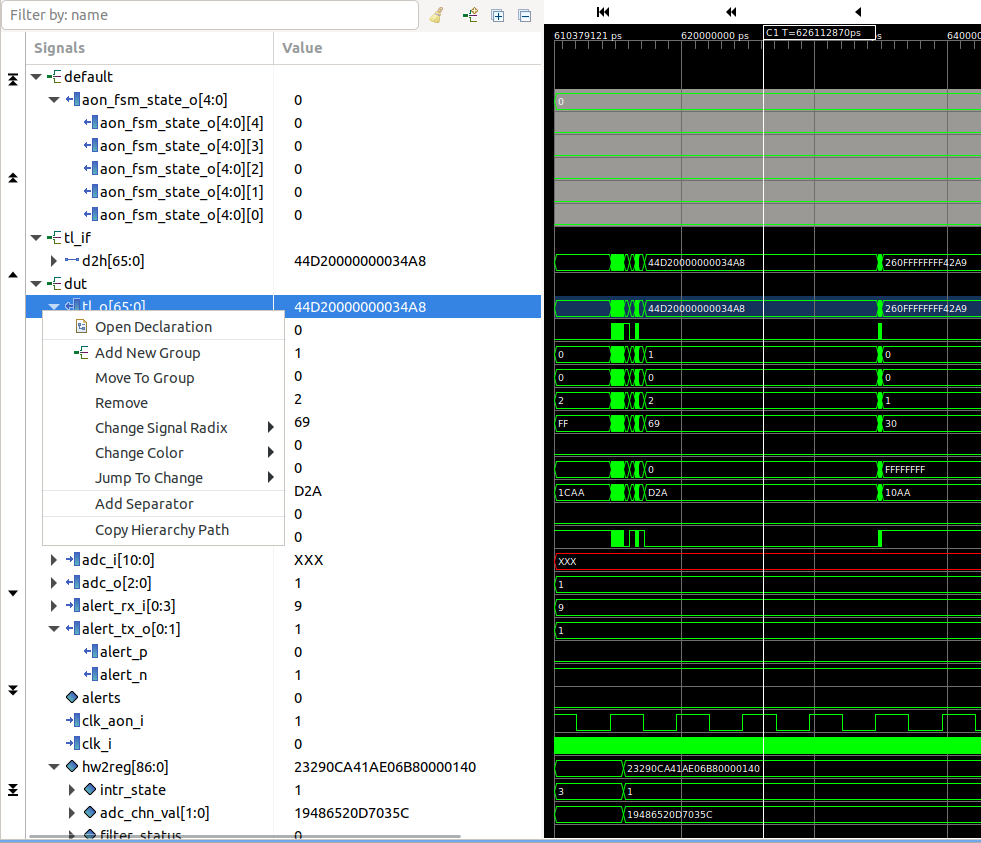
The Signals Panel shows all signals currently selected for display and their values at the timestamp of the primary cursor (see Waveform Canvas).
Hover a signal name to see its full hierarchical path. You can also Copy the Hierarchy Path to clipboard from the context menu.
Select one or more signals and use Drag & drop to rearrange them or move them between groups. Use the Add New Group  button to define new groups. The context menu also provides options for organizing signals: Add New Group, Move to Group and Add Separator with a customizable name.
You can tune the presentation even further from the context menu: Change the radix used for displaying values to either base 2/8/10/16 or ASCII, and even Change the color of text/color/background per signal.
For convenience, the context menu also provides an entry for Jumping to the prev / next change of a signal.
Select one or more signals and press the Delete or use the context menu entry to Remove them.
Note
You can expand signals with structured datatypes such as packed or unpacked arrays or structs to visualize individual components.
Tip
You can drag and drop array elements or struct members out of their parent’s scope to inspect them individually.
Waveform Canvas
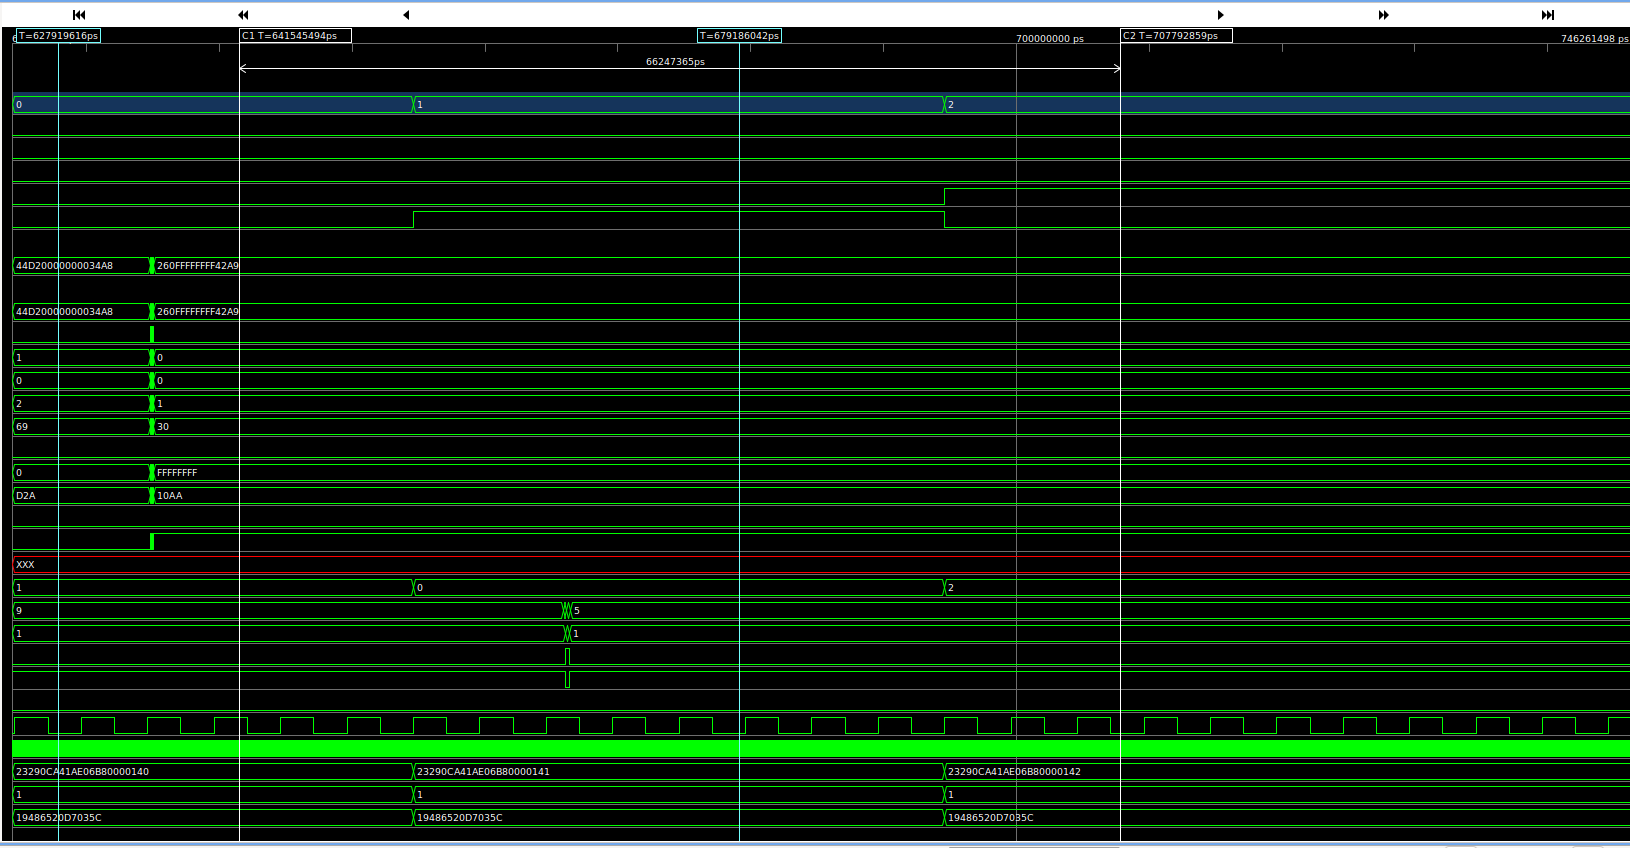
The Waveform Canvas displays the actual signal waveforms, using common visual representation conventions: single-bit signals are represented as square waves, while bus data uses rectangles with crossovers for transition. Valid logic values are green, high-impedance (Z) blue while undefined (X) are red.
The timeline at the top shows start and end timestamps of the currently displayed time window, with intermediate subdivisions. All timestamps use the $timescale unit specified in the VCD file.
Click & Drag anywhere in the canvas to move the time window (pan). Ctrl + scroll to zoom in or out. Ctrl + Click & Drag to zoom in to a selected time region. Plain scroll moves the selected signals up and down, in sync with the Signals Panel.
In the canvas, you can add two cursors and any number or markers:
Left-Click anywhere in the canvas to place Cursor C1 (a.k.a primary cursor). Note that it snaps to signal transitions. Its timestamp is shown in a label on the timeline. Click & drag the label to move the cursor. The Signals table values are updated based on the position of this cursor. Right-click on the timestamp label to remove the cursor.
Right-Click to place Cursor C2 (a.k.a secondary cursor). It can be used to quickly see time difference versus C1 or to compute statistics such as number of edges between C1 and C2 for a signal selected in the table. Move/remove using the timeline label, simiar to C1.
Middle-click anywhere on the canvas to add a Marker. Middle-click on its time label to remove. Markers serve as visual bookmarks in the timeline.
IDE Integration
When you first open the waveform viewer, it is automatically set as the Current Waveform for the project containing the VCD file. Adding signals from the editor or structured views will send them to the waveform viewer set as Current. Likewise, values shown in the tooltips and Inspect View will be linked to the cursor position in the Current Waveform.
If you work with multiple waveform viewers at the same time, simply press the Set current waveform button in the Toolbar to switch between them. You can always see the Current waveform  indicated in the status bar. Simply click on the status bar button to reveal the viewer. When no current waveform is set, the IDE integration features are disabled.
Note
DVT will notify you when there are mismatches between the signal paths read from the VCD file and the elaborated design hierarchy. For example when opening a waveform file generated using a different version of the design, the VCD might contain paths to signals that don’t exist, and consequently integration features will not be available.
Here is a detailed listing of all the IDE integration features:
- Views and editor
You can add signals to the current waveform from the Waveform Viewer context menu, either from an instance or from a port in the Design Hierarchy View or Outline View
Similar, you can add signals to the current waveform from the editor context menu. The Design Breadcrumb is used to determine the full hierarchical path of the signal.
In the Waveform Viewer sub-menu choose:
Add - Adds the selected port
Add with Drivers - Adds the selected port and all its drivers
Add with Loads - Adds the selected port and all its loads
Reveal - Brings the current waveform in focus, scrolls to the selected port and selects it
Add Ports - Adds all ports of the selected instance
Add All Signals - Adds all signals of the selected instance
The editor context menu also provides the ability to Create a WaveDrom Diagram based on the Current Waveform.
- Tooltips
First, make sure you place a primary cursor in the waveform viewer (see Waveform Canvas). Then, hover any signal in the editor and the tooltip will include the signal value at the timestamp of the cursor.
- Inspect View
First, make sure you place a primary cursor in the waveform viewer (see Waveform Canvas). Place the editor cursor on a signal in the editor and the Inspect View gets updated with:
the signal value at the timestamp of the cursor
the signal value at the timestamp of the next edge
the signal value at the timestamp of the previous edge
- Schematic Diagrams
In the Schematic Diagrams you can see the port values and trace their connections.
To display the wave information in diagrams, enable the Show Waveform Info preference in the diagram preferences dialog, which can be found in the Diagram Toolbar. You can also change the default Schematic Diagram preferences through .
First, make sure you place a primary cursor in the waveform viewer (see Waveform Canvas). Then, open a Schematic Diagram and check the wave value for each port at the timestamp of the cursor. The cursor timestamp and the selected waveform file will always be visible in the upper part of the diagram.
- WaveDrom Diagrams
There are multiple ways to create a WaveDrom Diagram based on the Current Waveform.
Editor context menu
In the editor, Right-Click on a design scope declaration or instance.
Select .
The diagram is automatically inserted above the current line.
-
Set a design scope definition as Factory Input.
Right-Click in the editor to open the context menu.
Select .
Note
The time interval used to create the WaveDrom Diagram depends on the primary and secondary cursors of the Current Waveform.
No cursors placed - the visible time interval is selected.
One cursor placed - the time interval between the lowest visible time and the cursor is selected.
Both cursors placed - the time interval between the cursors is selected.
Note
Creating a WaveDrom Diagram based on a design scope definition uses the Design Breadcrumb to determine the target instance.
Tip
You can find action shortcuts in Quick Access (Ctrl + 3).